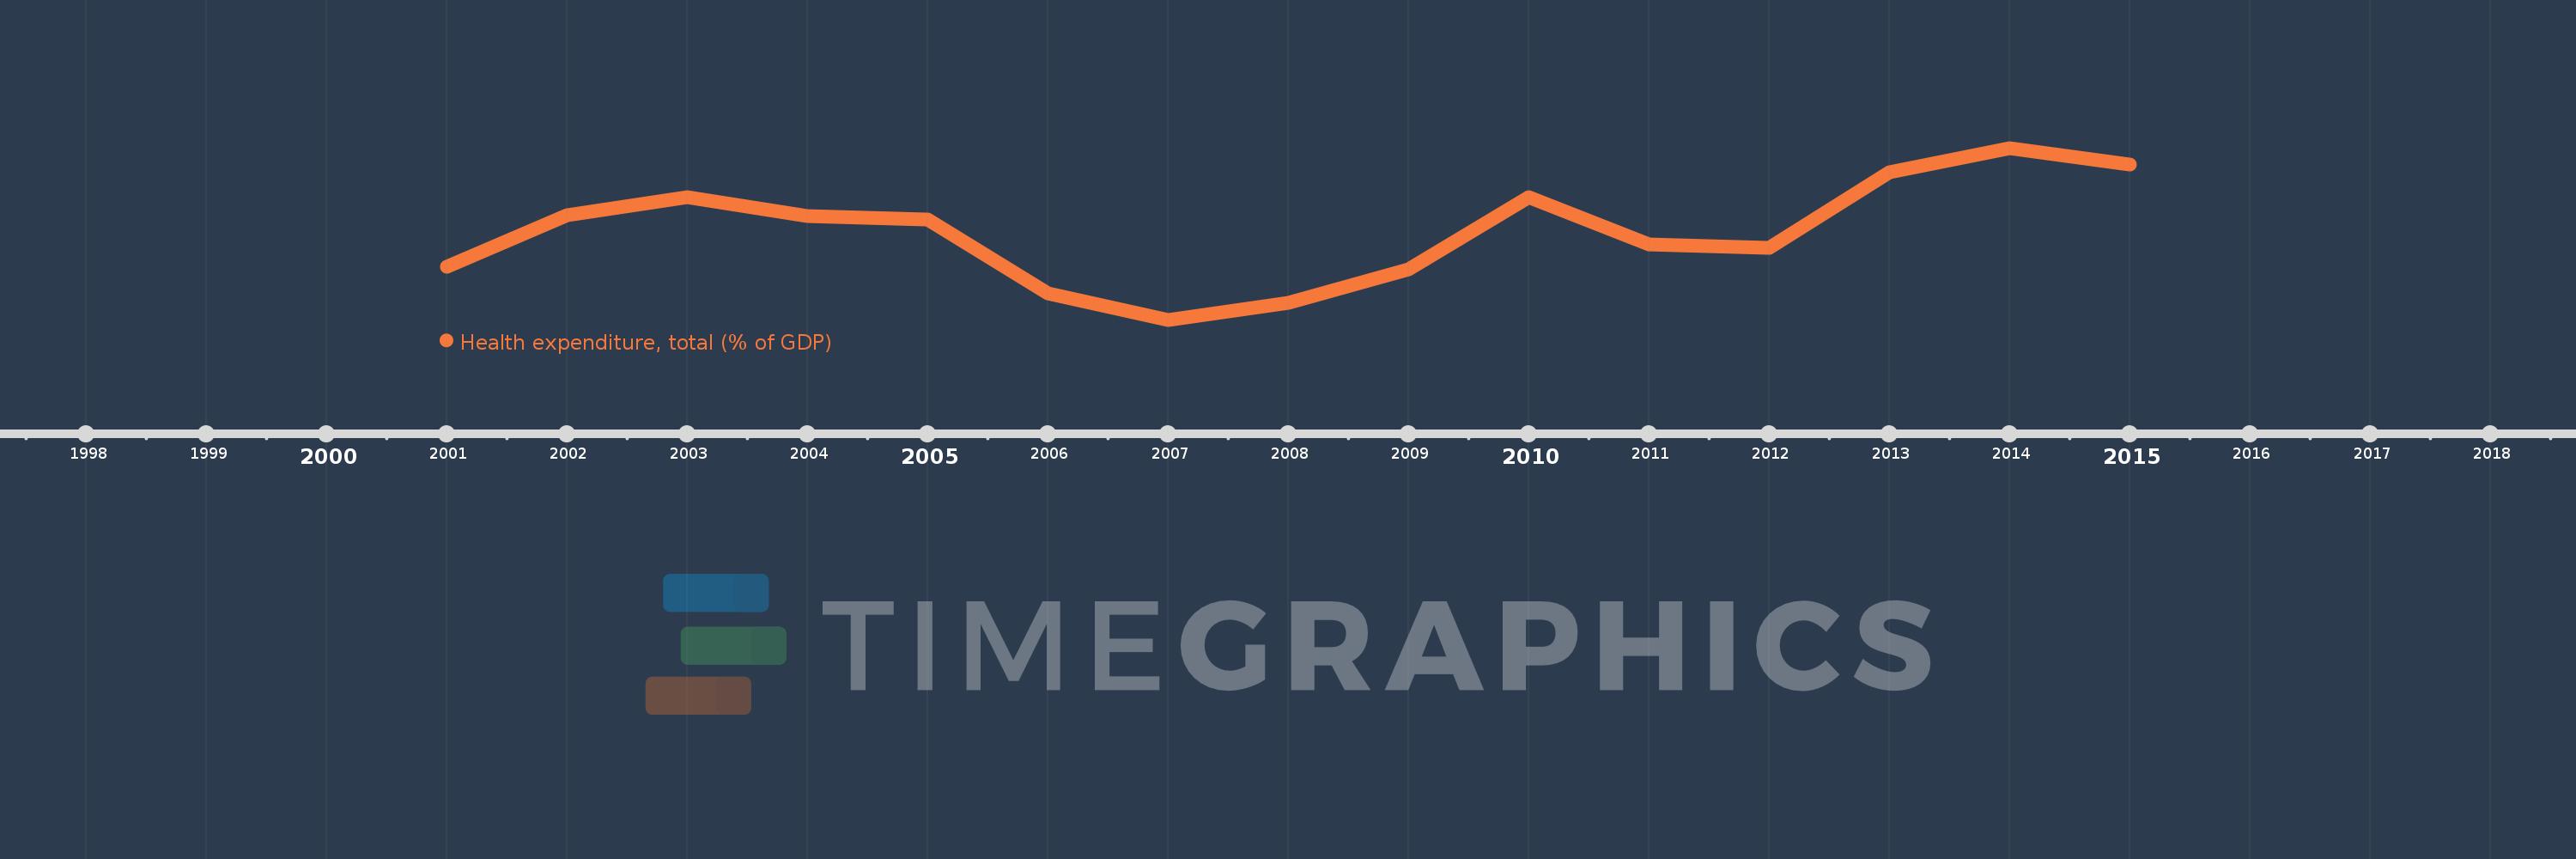
This timeline shows a graph from 2001 to 2015 of Fragile and conflict affected situations. No data until 2000. Number of actual observations by date: 15.
Source name:
World Development Indicators
Source organization:
World Health Organization Global Health Expenditure database (see http://apps.who.int/nha/database for the most recent updates).
Categories, topics:
Health
Last updated:
apr 23, 2017
Indicators value changes by year
Meaning:
5.024
Minimum:
4.193
jan 1, 2007
Maximum:
5.813
jan 1, 2014
At the date of observation
Value
Absolute change
Change from the previous value
jan 1, 2001
4.692
+4.692
0.0%
jan 1, 2002
5.18
+0.488
10.4%
jan 1, 2003
5.351
+0.171
3.29%
jan 1, 2004
5.172
-0.179
-3.35%
jan 1, 2005
5.137
-0.035
-0.68%
jan 1, 2006
4.442
-0.695
-13.52%
jan 1, 2007
4.193
-0.249
-5.61%
jan 1, 2008
4.351
+0.158
3.78%
jan 1, 2009
4.669
+0.318
7.3%
jan 1, 2010
5.345
+0.676
14.48%
jan 1, 2011
4.905
-0.44
-8.23%
jan 1, 2012
4.869
-0.036
-0.73%
jan 1, 2013
5.586
+0.717
14.72%
jan 1, 2014
5.813
+0.228
4.08%
jan 1, 2015
5.656
-0.157
-2.7%
Ranking of countries by current statistics by years