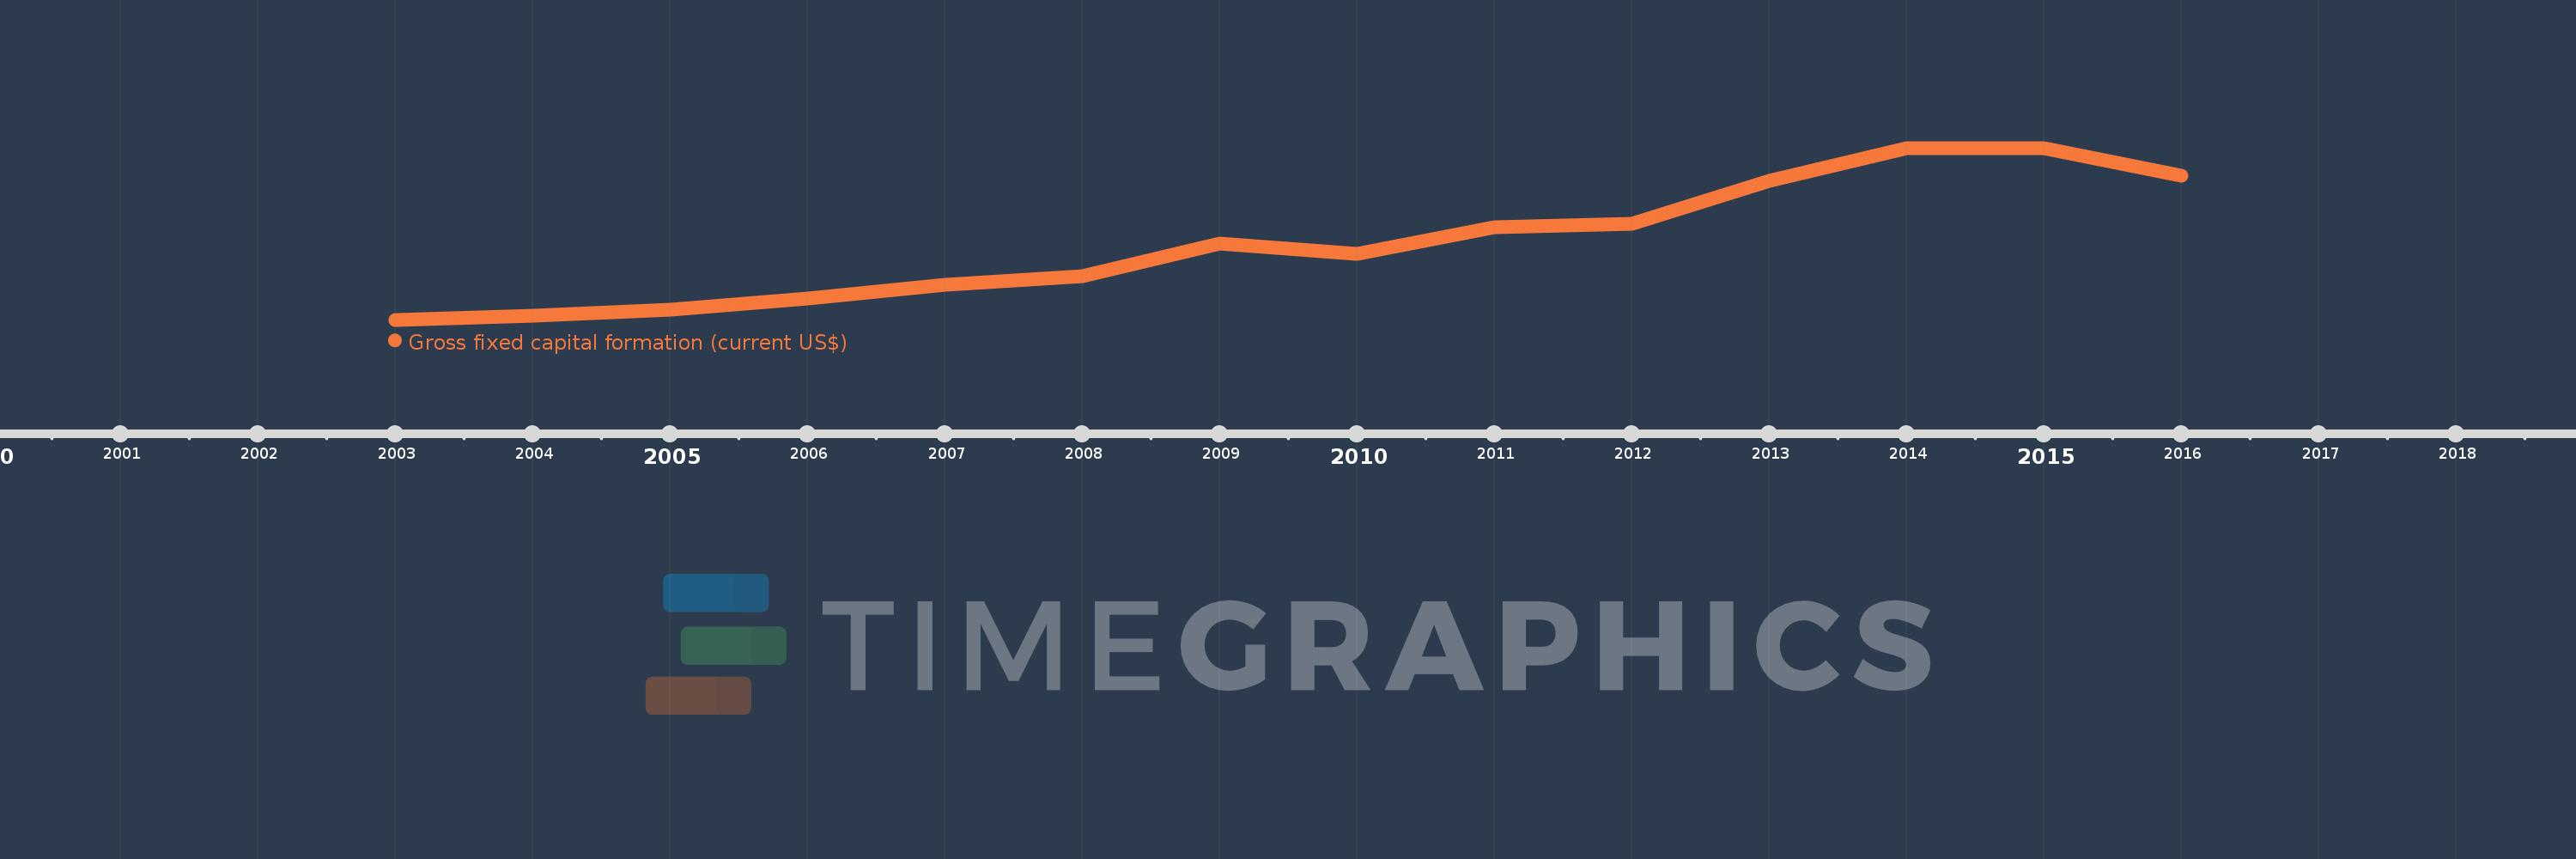
This timeline shows a graph from 2003 to 2016 of Fragile and conflict affected situations. No data until 2002. Number of actual observations by date: 14.
Source name:
World Development Indicators
Source organization:
World Bank national accounts data, and OECD National Accounts data files.
Categories, topics:
Economy & Growth
Last updated:
apr 23, 2017
Indicators value changes by year
Meaning:
101.138 bln
Minimum:
25.235 bln
jan 1, 2003
Maximum:
195.925 bln
jan 1, 2015
At the date of observation
Value
Absolute change
Change from the previous value
jan 1, 2003
25.235 bln
+25.235 bln
0.0%
jan 1, 2004
28.889 bln
+3.654 bln
14.48%
jan 1, 2005
35.035 bln
+6.146 bln
21.27%
jan 1, 2006
46.583 bln
+11.548 bln
32.96%
jan 1, 2007
59.951 bln
+13.368 bln
28.7%
jan 1, 2008
68.875 bln
+8.923 bln
14.88%
jan 1, 2009
100.684 bln
+31.809 bln
46.18%
jan 1, 2010
90.408 bln
-10.276 bln
-10.21%
jan 1, 2011
116.828 bln
+26.42 bln
29.22%
jan 1, 2012
120.504 bln
+3.676 bln
3.15%
jan 1, 2013
163.491 bln
+42.988 bln
35.67%
jan 1, 2014
195.486 bln
+31.995 bln
19.57%
jan 1, 2015
195.925 bln
+438.972 mln
0.22%
jan 1, 2016
168.042 bln
-27.883 bln
-14.23%
Ranking of countries by current statistics by years