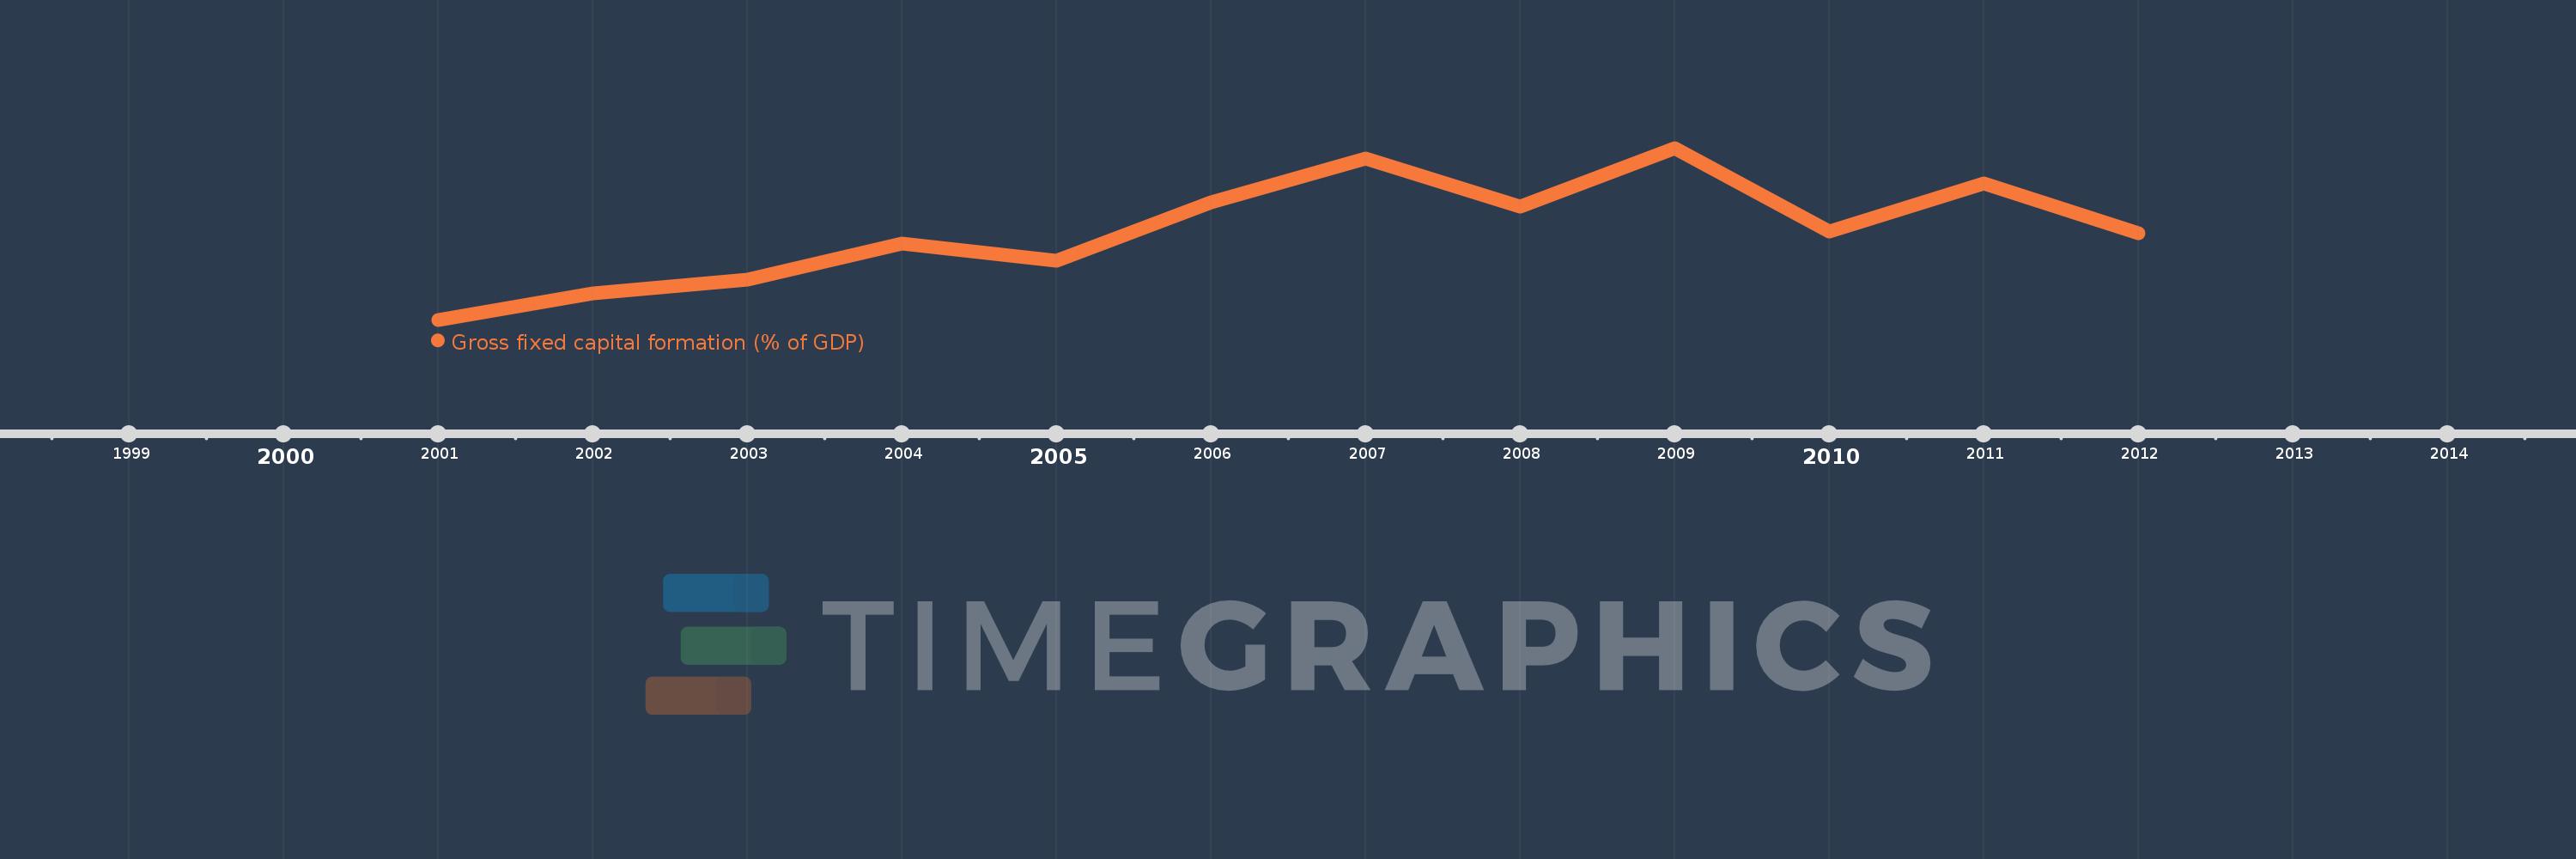
This timeline shows a graph from 2001 to 2012 of Fragile and conflict affected situations. No data until 2000. Number of actual observations by date: 12.
Source name:
World Development Indicators
Source organization:
World Bank national accounts data, and OECD National Accounts data files.
Categories, topics:
Economy & Growth
Last updated:
apr 23, 2017
Indicators value changes by year
Meaning:
16.448
Minimum:
12.787
jan 1, 2001
Maximum:
19.801
jan 1, 2009
At the date of observation
Value
Absolute change
Change from the previous value
jan 1, 2001
12.787
+12.787
0.0%
jan 1, 2002
13.878
+1.09
8.53%
jan 1, 2003
14.421
+0.543
3.92%
jan 1, 2004
15.883
+1.461
10.13%
jan 1, 2005
15.204
-0.678
-4.27%
jan 1, 2006
17.597
+2.392
15.74%
jan 1, 2007
19.353
+1.756
9.98%
jan 1, 2008
17.414
-1.938
-10.02%
jan 1, 2009
19.801
+2.387
13.71%
jan 1, 2010
16.375
-3.426
-17.3%
jan 1, 2011
18.337
+1.962
11.98%
jan 1, 2012
16.32
-2.017
-11.0%
Ranking of countries by current statistics by years