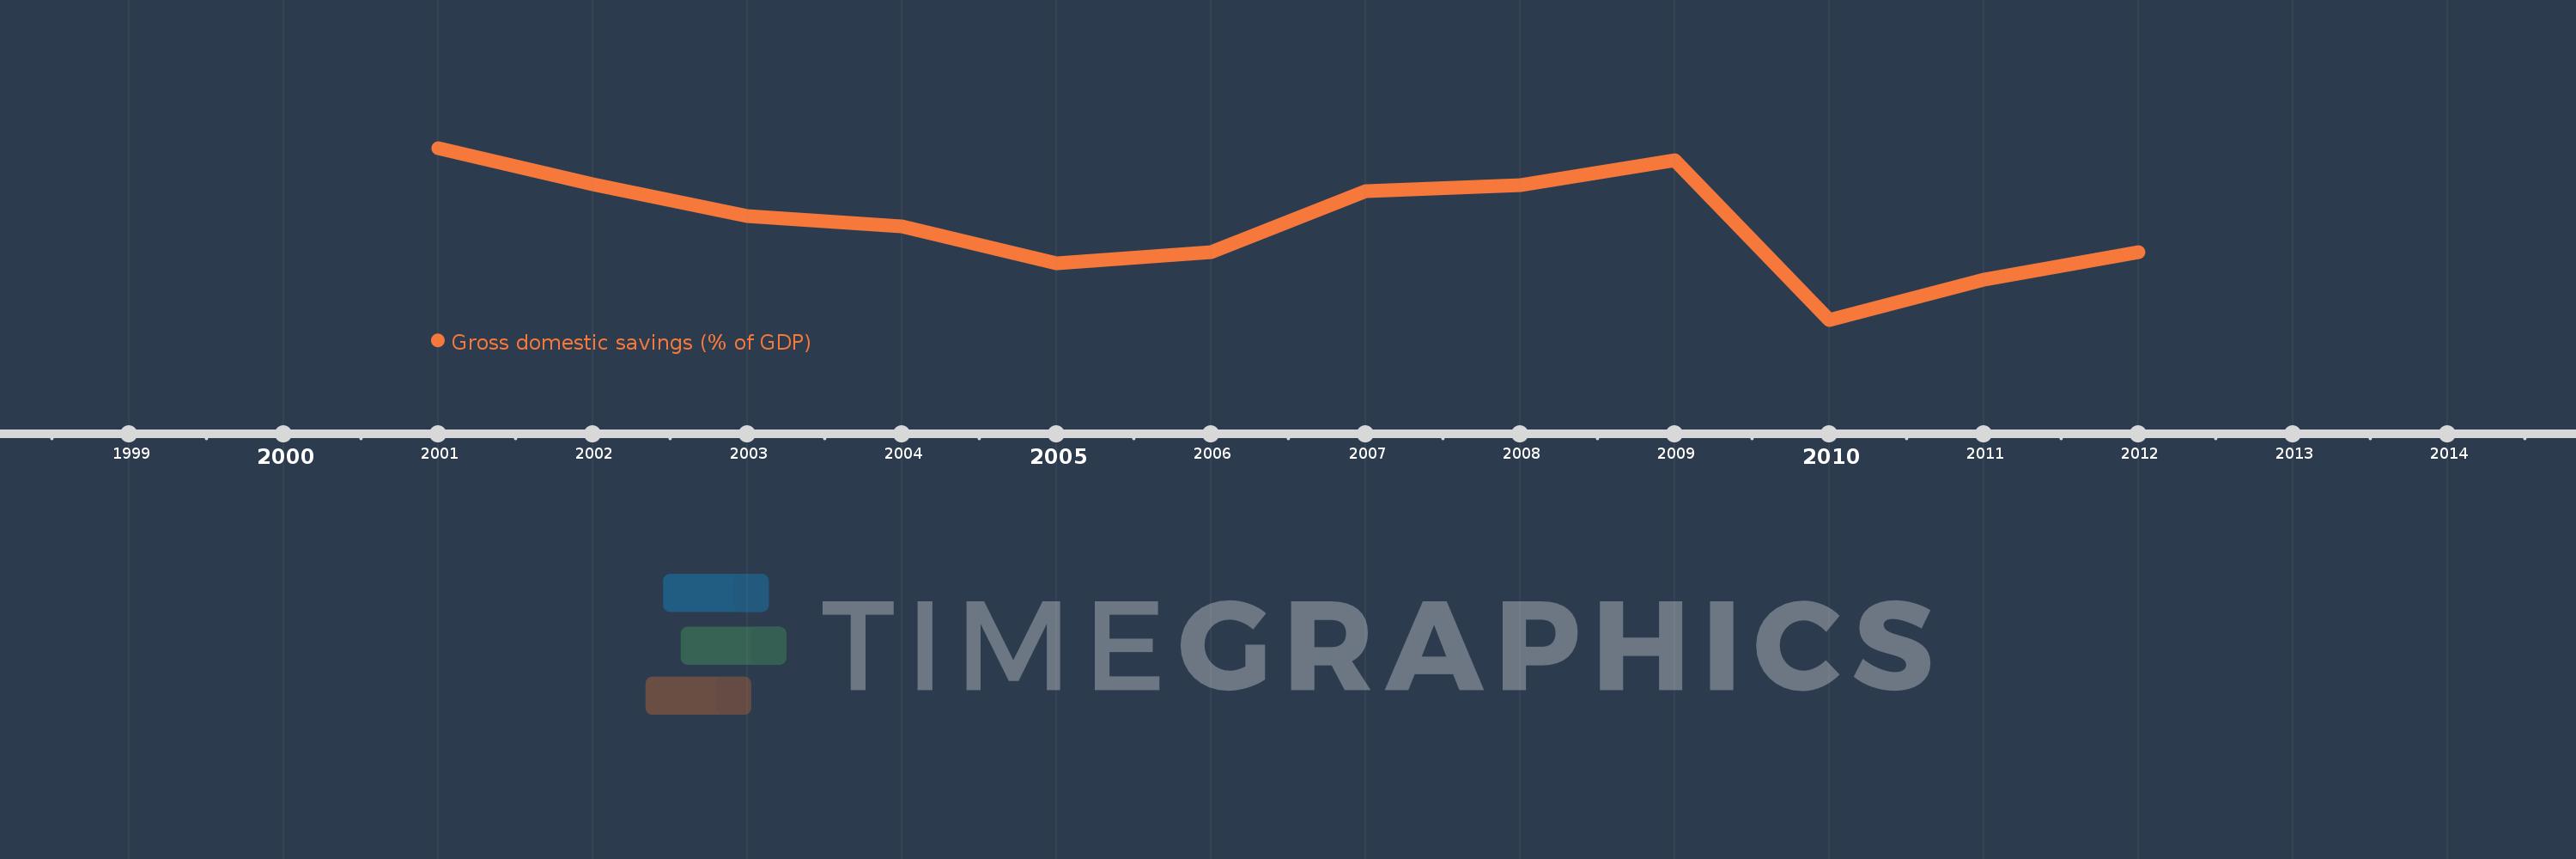
This timeline shows a graph from 2001 to 2012 of Fragile and conflict affected situations. No data until 2000. Number of actual observations by date: 12.
Source name:
World Development Indicators
Source organization:
World Bank national accounts data, and OECD National Accounts data files.
Categories, topics:
Economy & Growth
Last updated:
apr 23, 2017
Indicators value changes by year
Meaning:
19.858
Minimum:
9.034
jan 1, 2010
Maximum:
28.298
jan 1, 2001
At the date of observation
Value
Absolute change
Change from the previous value
jan 1, 2001
28.298
+28.298
0.0%
jan 1, 2002
24.252
-4.046
-14.3%
jan 1, 2003
20.675
-3.577
-14.75%
jan 1, 2004
19.495
-1.18
-5.71%
jan 1, 2005
15.325
-4.17
-21.39%
jan 1, 2006
16.57
+1.245
8.12%
jan 1, 2007
23.477
+6.907
41.68%
jan 1, 2008
24.146
+0.669
2.85%
jan 1, 2009
26.926
+2.78
11.51%
jan 1, 2010
9.034
-17.891
-66.45%
jan 1, 2011
13.497
+4.463
49.4%
jan 1, 2012
16.595
+3.098
22.95%
Ranking of countries by current statistics by years