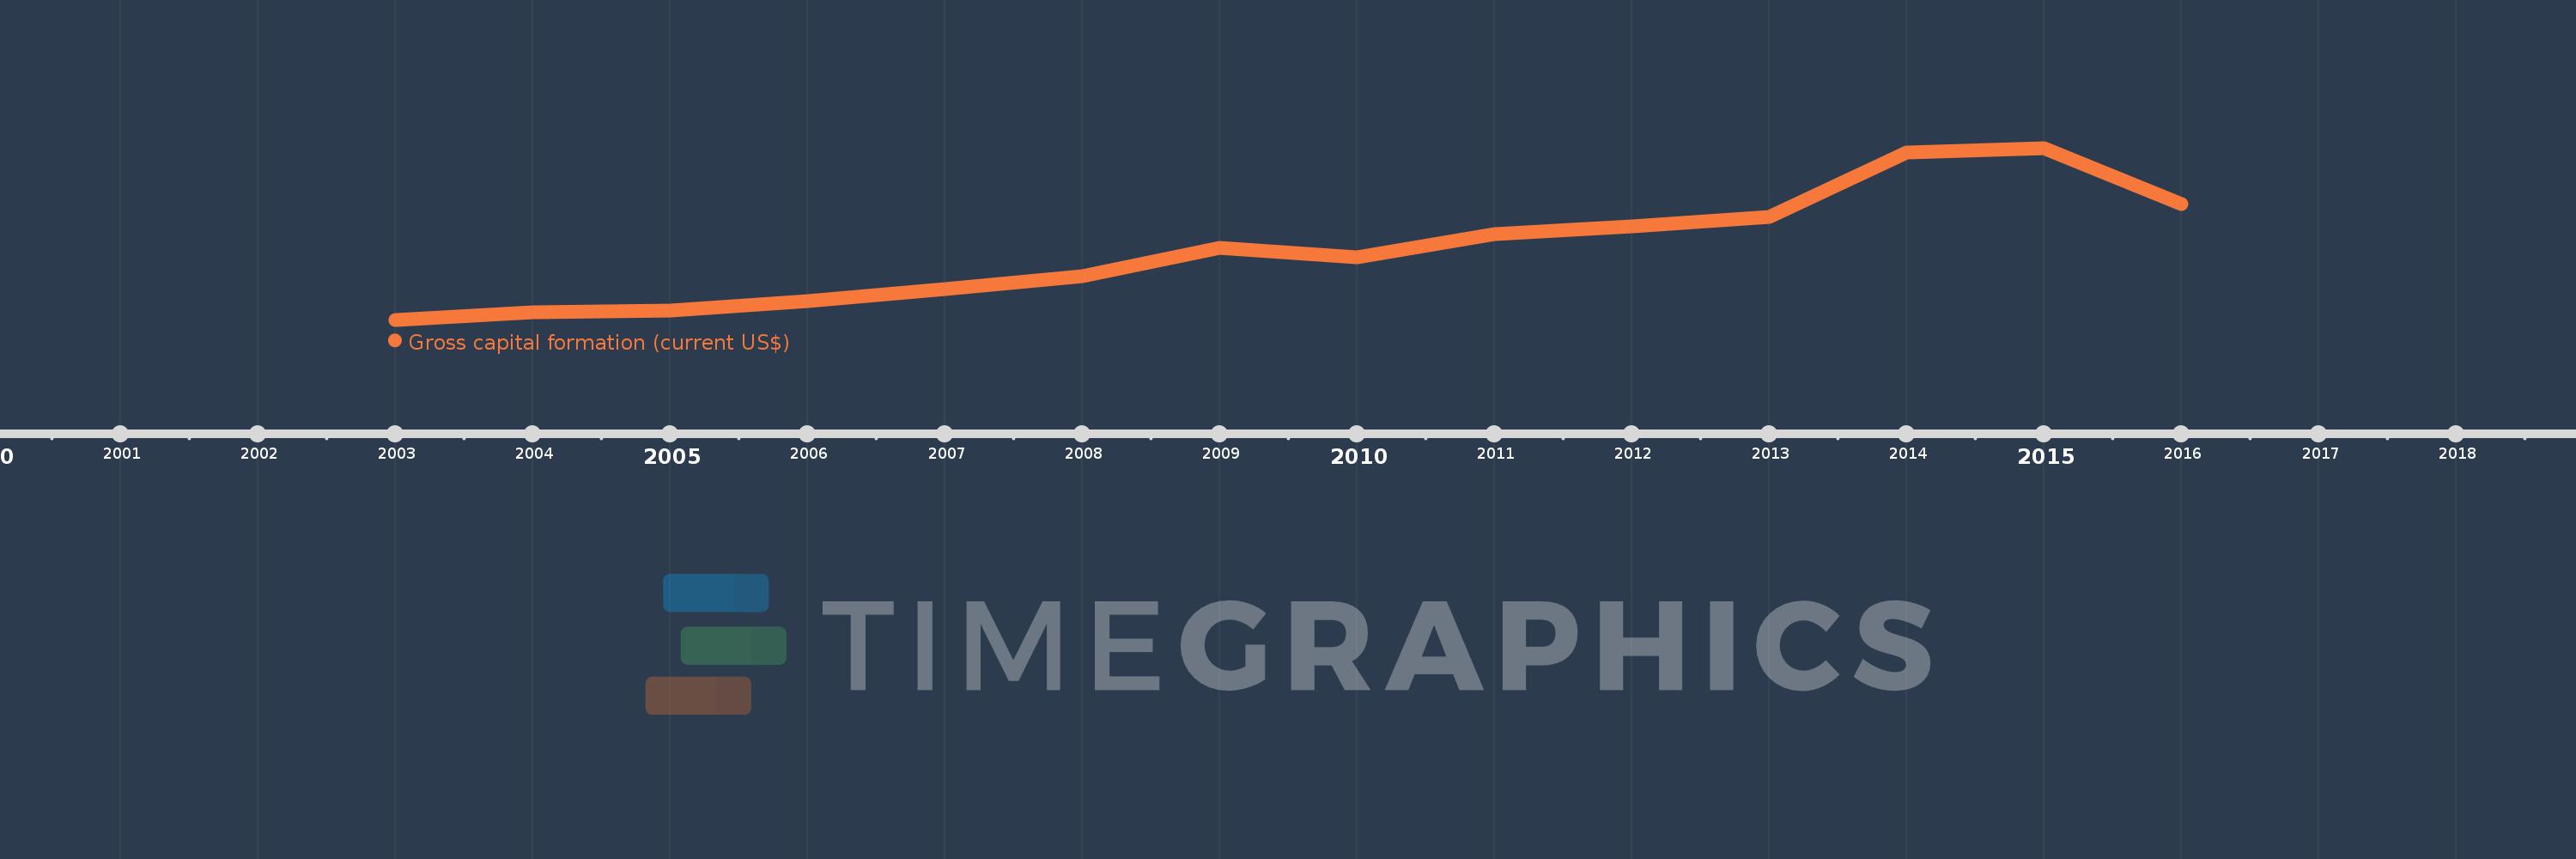
This timeline shows a graph from 2003 to 2016 of Fragile and conflict affected situations. No data until 2002. Number of actual observations by date: 14.
Source name:
World Development Indicators
Source organization:
World Bank national accounts data, and OECD National Accounts data files.
Categories, topics:
Economy & Growth
Last updated:
apr 23, 2017
Indicators value changes by year
Meaning:
103.403 bln
Minimum:
28.496 bln
jan 1, 2003
Maximum:
212.372 bln
jan 1, 2015
At the date of observation
Value
Absolute change
Change from the previous value
jan 1, 2003
28.496 bln
+28.496 bln
0.0%
jan 1, 2004
36.064 bln
+7.568 bln
26.56%
jan 1, 2005
38.353 bln
+2.288 bln
6.34%
jan 1, 2006
48.229 bln
+9.876 bln
25.75%
jan 1, 2007
60.893 bln
+12.664 bln
26.26%
jan 1, 2008
75.552 bln
+14.66 bln
24.07%
jan 1, 2009
105.732 bln
+30.179 bln
39.95%
jan 1, 2010
95.023 bln
-10.709 bln
-10.13%
jan 1, 2011
120.056 bln
+25.034 bln
26.34%
jan 1, 2012
128.491 bln
+8.434 bln
7.03%
jan 1, 2013
138.323 bln
+9.832 bln
7.65%
jan 1, 2014
207.444 bln
+69.121 bln
49.97%
jan 1, 2015
212.372 bln
+4.928 bln
2.38%
jan 1, 2016
152.615 bln
-59.757 bln
-28.14%
Ranking of countries by current statistics by years