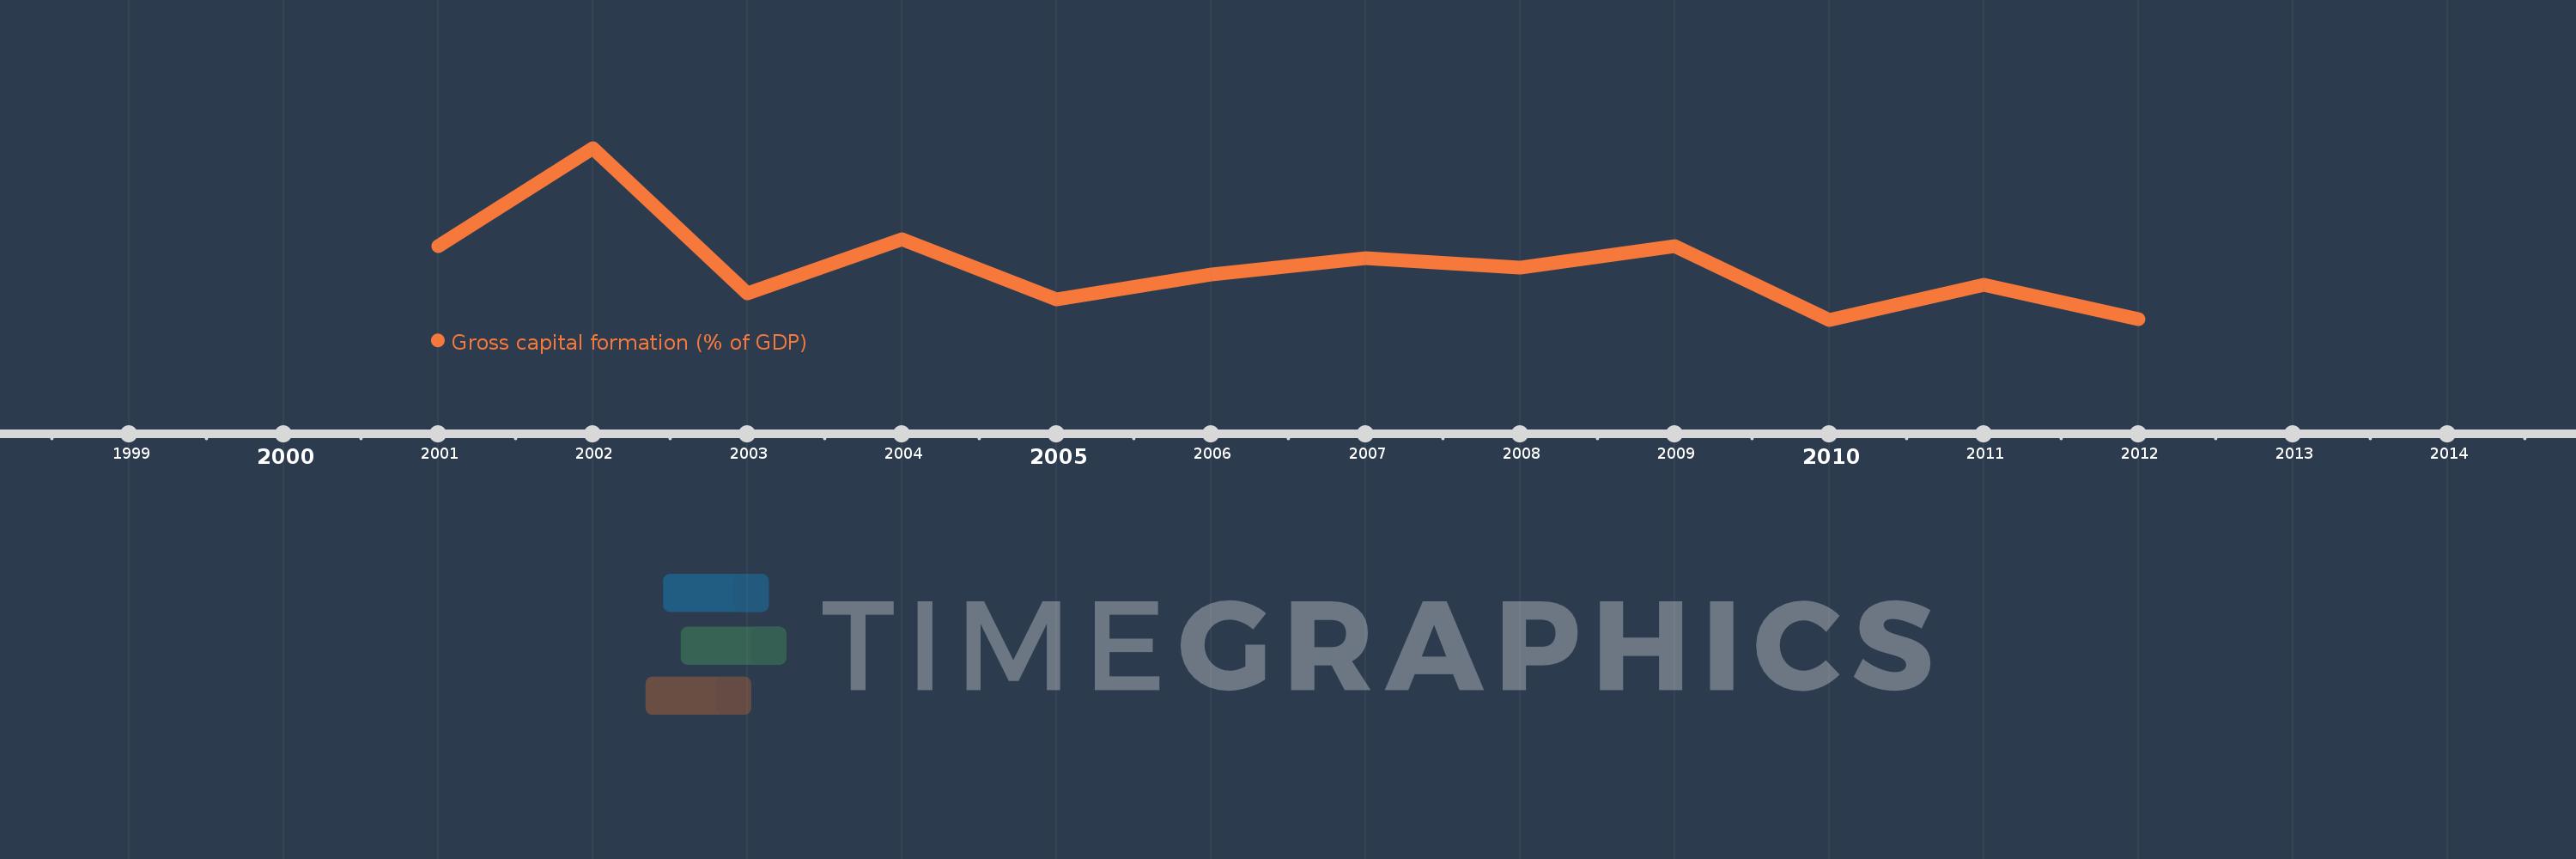
This timeline shows a graph from 2001 to 2012 of Fragile and conflict affected situations. No data until 2000. Number of actual observations by date: 12.
Source name:
World Development Indicators
Source organization:
World Bank national accounts data, and OECD National Accounts data files.
Categories, topics:
Economy & Growth
Last updated:
apr 23, 2017
Indicators value changes by year
Meaning:
19.621
Minimum:
17.225
jan 1, 2010
Maximum:
24.951
jan 1, 2002
At the date of observation
Value
Absolute change
Change from the previous value
jan 1, 2001
20.553
+20.553
0.0%
jan 1, 2002
24.951
+4.398
21.4%
jan 1, 2003
18.397
-6.554
-26.27%
jan 1, 2004
20.843
+2.446
13.3%
jan 1, 2005
18.122
-2.72
-13.05%
jan 1, 2006
19.25
+1.128
6.22%
jan 1, 2007
19.985
+0.735
3.82%
jan 1, 2008
19.554
-0.431
-2.16%
jan 1, 2009
20.533
+0.979
5.01%
jan 1, 2010
17.225
-3.308
-16.11%
jan 1, 2011
18.783
+1.558
9.05%
jan 1, 2012
17.26
-1.523
-8.11%
Ranking of countries by current statistics by years