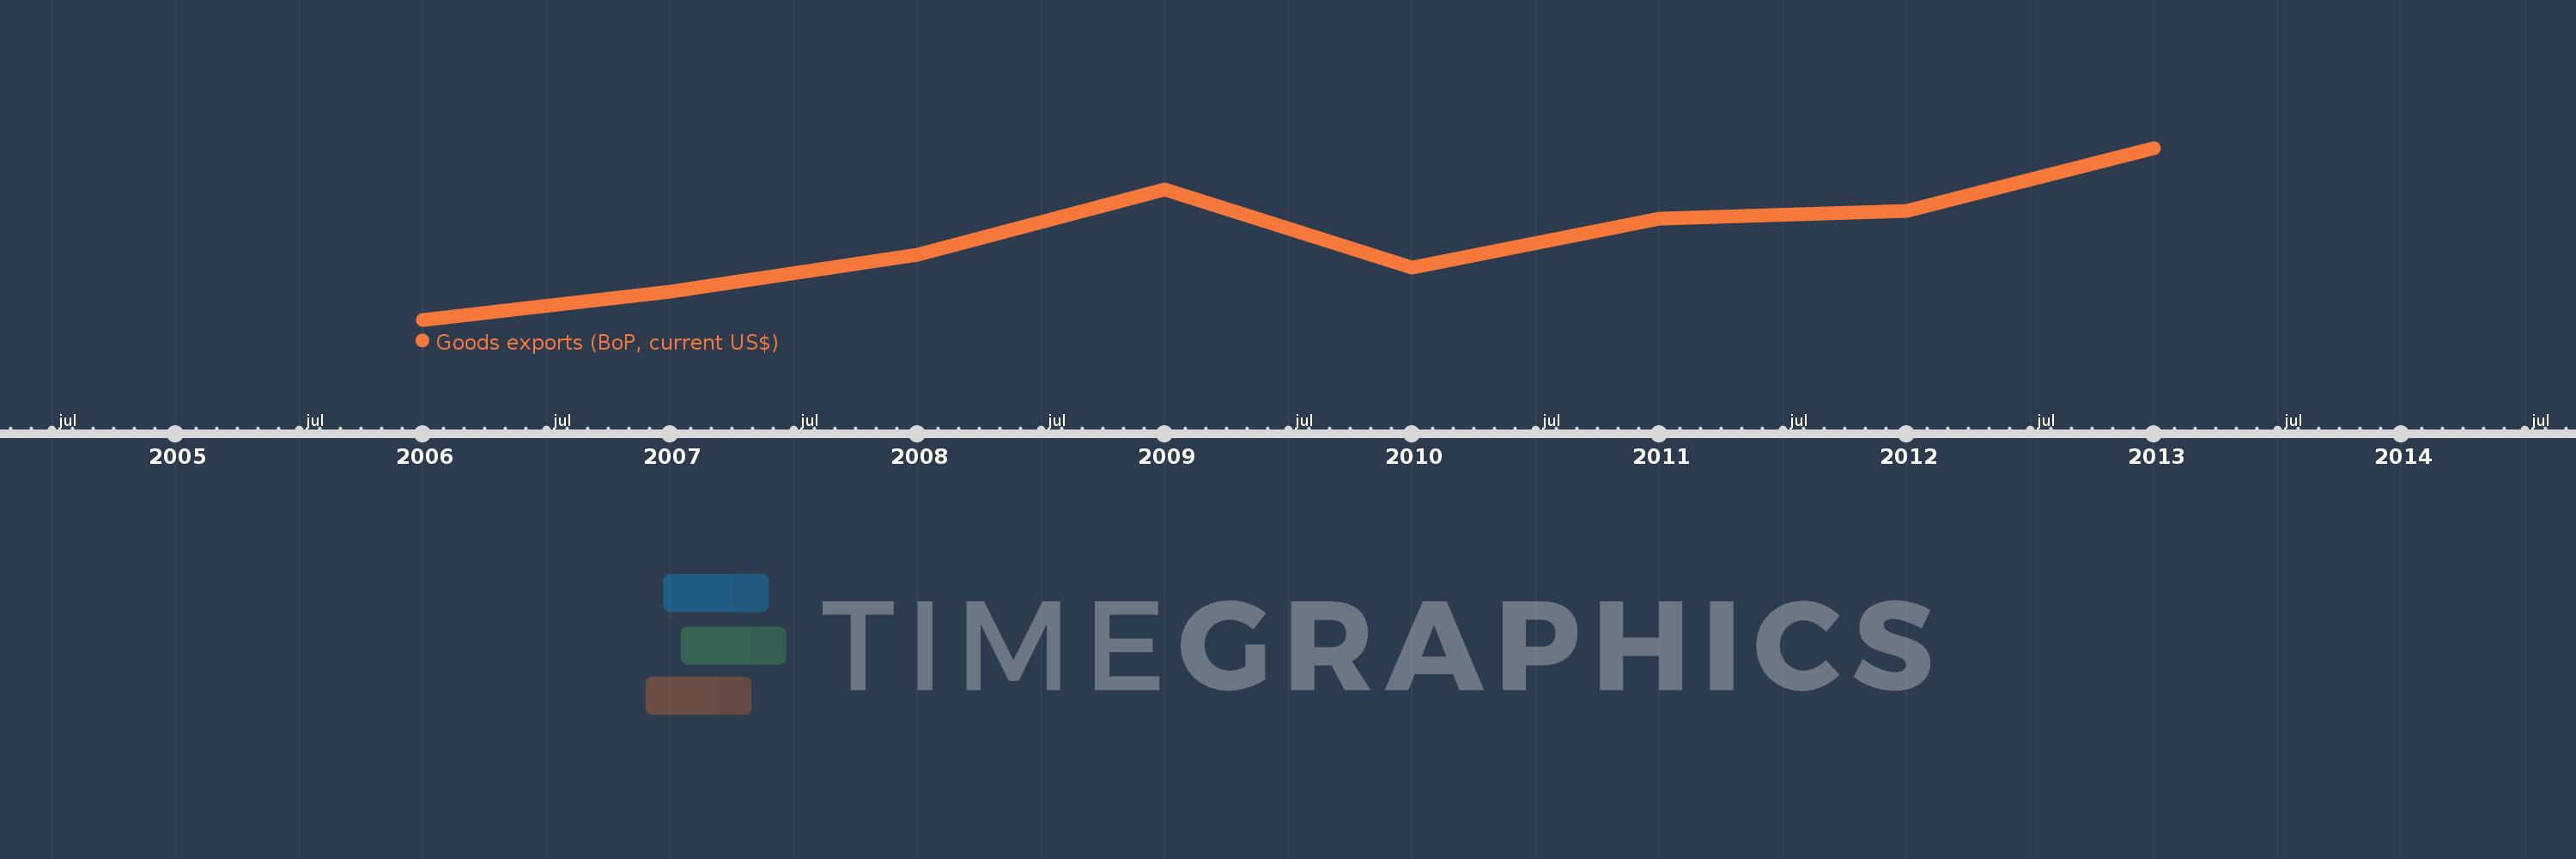
This timeline shows a graph from 2006 to 2013 of Fragile and conflict affected situations. No data until 2005. Number of actual observations by date: 8.
Source name:
World Development Indicators
Source organization:
International Monetary Fund, Balance of Payments Statistics Yearbook and data files.
Categories, topics:
Economy & Growth, Trade
Last updated:
apr 23, 2017
Indicators value changes by year
Meaning:
177.395 bln
Minimum:
104.574 bln
jan 1, 2006
Maximum:
256.998 bln
jan 1, 2013
At the date of observation
Value
Absolute change
Change from the previous value
jan 1, 2006
104.574 bln
+104.574 bln
0.0%
jan 1, 2007
129.426 bln
+24.852 bln
23.76%
jan 1, 2008
162.08 bln
+32.654 bln
25.23%
jan 1, 2009
220.158 bln
+58.078 bln
35.83%
jan 1, 2010
150.458 bln
-69.7 bln
-31.66%
jan 1, 2011
194.142 bln
+43.684 bln
29.03%
jan 1, 2012
201.324 bln
+7.182 bln
3.7%
jan 1, 2013
256.998 bln
+55.674 bln
27.65%
Ranking of countries by current statistics by years