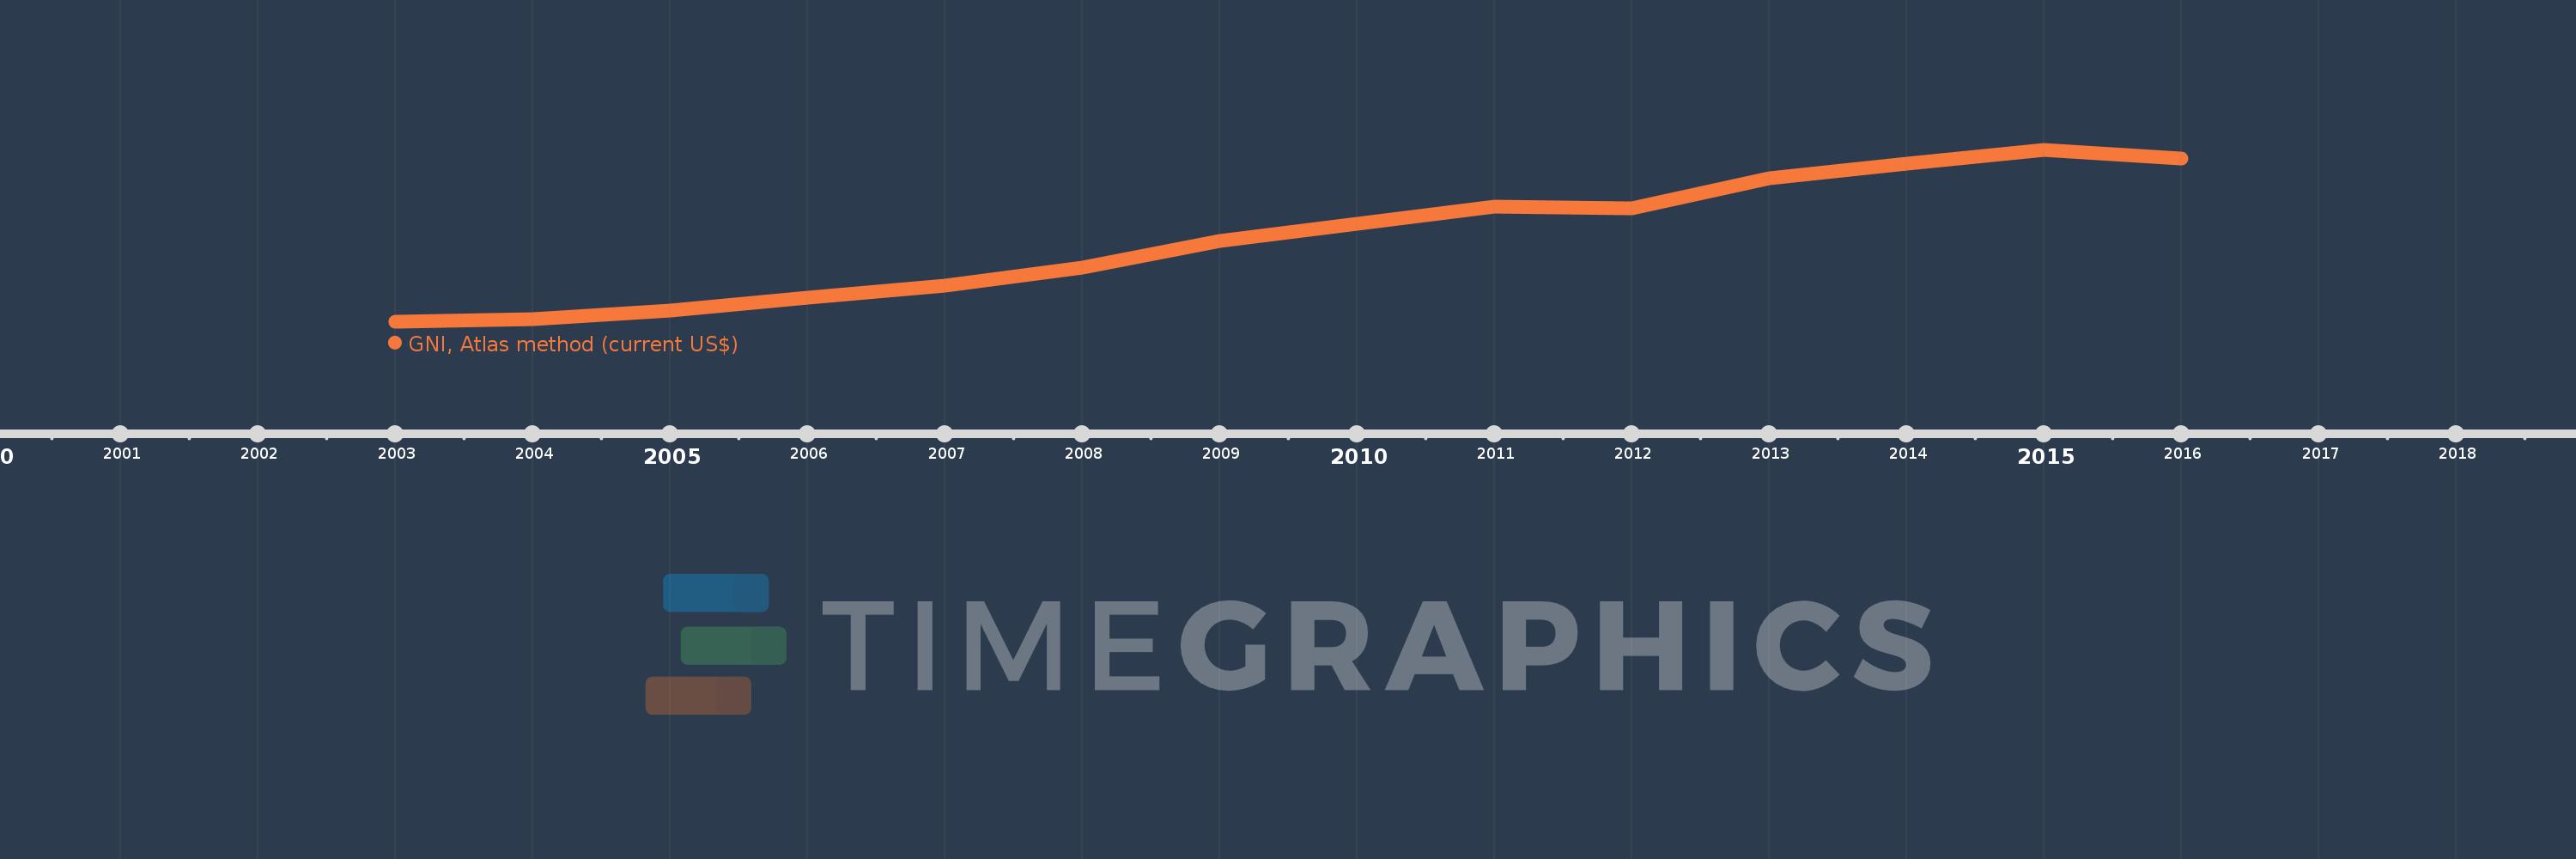
This timeline shows a graph from 2003 to 2016 of Fragile and conflict affected situations. No data until 2002. Number of actual observations by date: 14.
Source name:
World Development Indicators
Source organization:
World Bank national accounts data, and OECD National Accounts data files.
Categories, topics:
Economy & Growth
Last updated:
apr 23, 2017
Indicators value changes by year
Meaning:
478.888 bln
Minimum:
195.117 bln
jan 1, 2003
Maximum:
775.437 bln
jan 1, 2015
At the date of observation
Value
Absolute change
Change from the previous value
jan 1, 2003
195.117 bln
+195.117 bln
0.0%
jan 1, 2004
203.369 bln
+8.253 bln
4.23%
jan 1, 2005
234.517 bln
+31.148 bln
15.32%
jan 1, 2006
278.597 bln
+44.079 bln
18.8%
jan 1, 2007
317.416 bln
+38.82 bln
13.93%
jan 1, 2008
378.827 bln
+61.41 bln
19.35%
jan 1, 2009
467.364 bln
+88.537 bln
23.37%
jan 1, 2010
527.94 bln
+60.576 bln
12.96%
jan 1, 2011
586.06 bln
+58.12 bln
11.01%
jan 1, 2012
579.577 bln
-6.483 bln
-1.11%
jan 1, 2013
681.294 bln
+101.716 bln
17.55%
jan 1, 2014
730.273 bln
+48.98 bln
7.19%
jan 1, 2015
775.437 bln
+45.164 bln
6.18%
jan 1, 2016
748.644 bln
-26.793 bln
-3.46%
Ranking of countries by current statistics by years