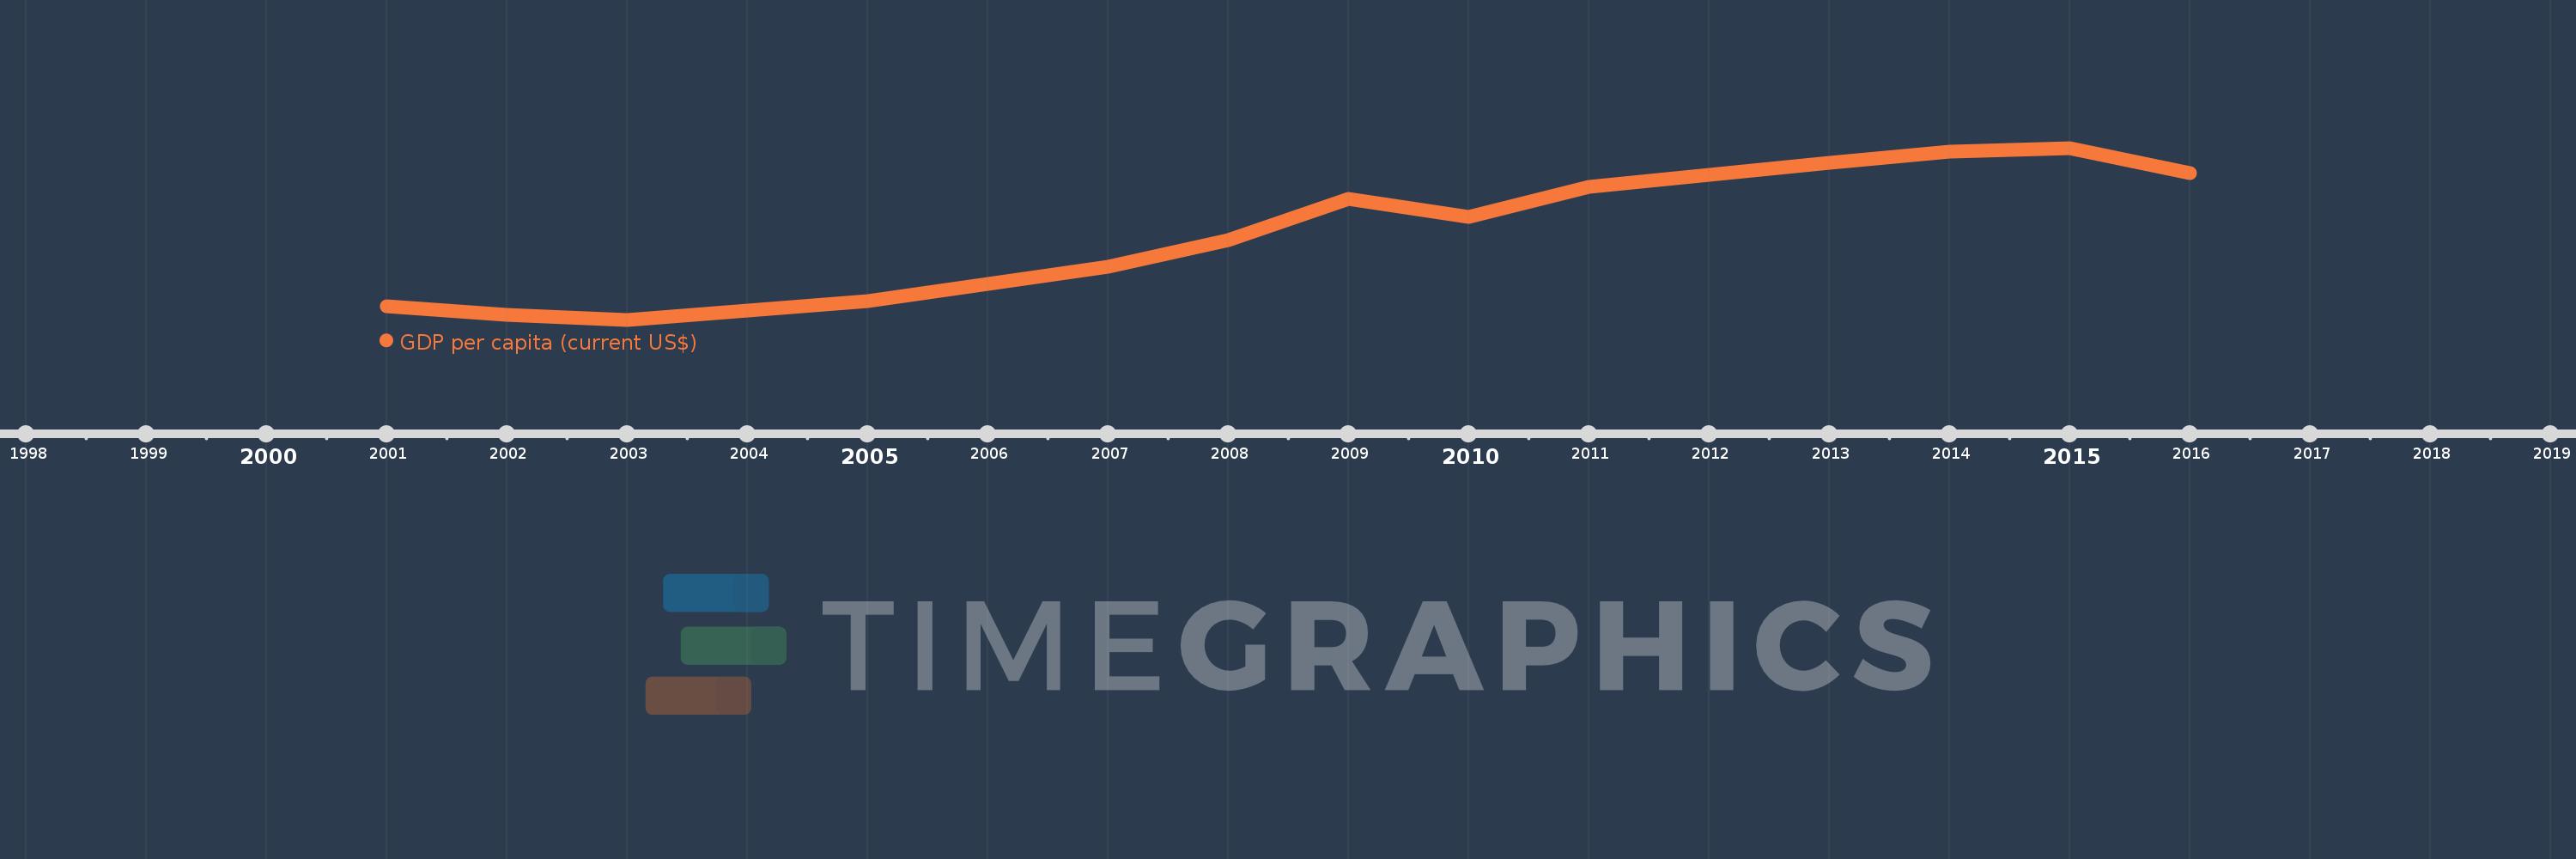
This timeline shows a graph from 2001 to 2016 of Fragile and conflict affected situations. No data until 2000. Number of actual observations by date: 16.
Source name:
World Development Indicators
Source organization:
World Bank national accounts data, and OECD National Accounts data files.
Categories, topics:
Economy & Growth
Last updated:
apr 23, 2017
Indicators value changes by year
Meaning:
1.117K
Minimum:
538.524
jan 1, 2003
Maximum:
1.708K
jan 1, 2015
At the date of observation
Value
Absolute change
Change from the previous value
jan 1, 2001
631.213
+631.213
0.0%
jan 1, 2002
569.62
-61.593
-9.76%
jan 1, 2003
538.524
-31.096
-5.46%
jan 1, 2004
598.308
+59.784
11.1%
jan 1, 2005
663.386
+65.078
10.88%
jan 1, 2006
784.971
+121.585
18.33%
jan 1, 2007
896.923
+111.952
14.26%
jan 1, 2008
1.083K
+185.962
20.73%
jan 1, 2009
1.363K
+280.21
25.88%
jan 1, 2010
1.241K
-122.034
-8.95%
jan 1, 2011
1.443K
+201.524
16.24%
jan 1, 2012
1.526K
+83.771
5.81%
jan 1, 2013
1.609K
+82.397
5.4%
jan 1, 2014
1.681K
+71.987
4.47%
jan 1, 2015
1.708K
+27.136
1.61%
jan 1, 2016
1.538K
-169.799
-9.94%
Ranking of countries by current statistics by years