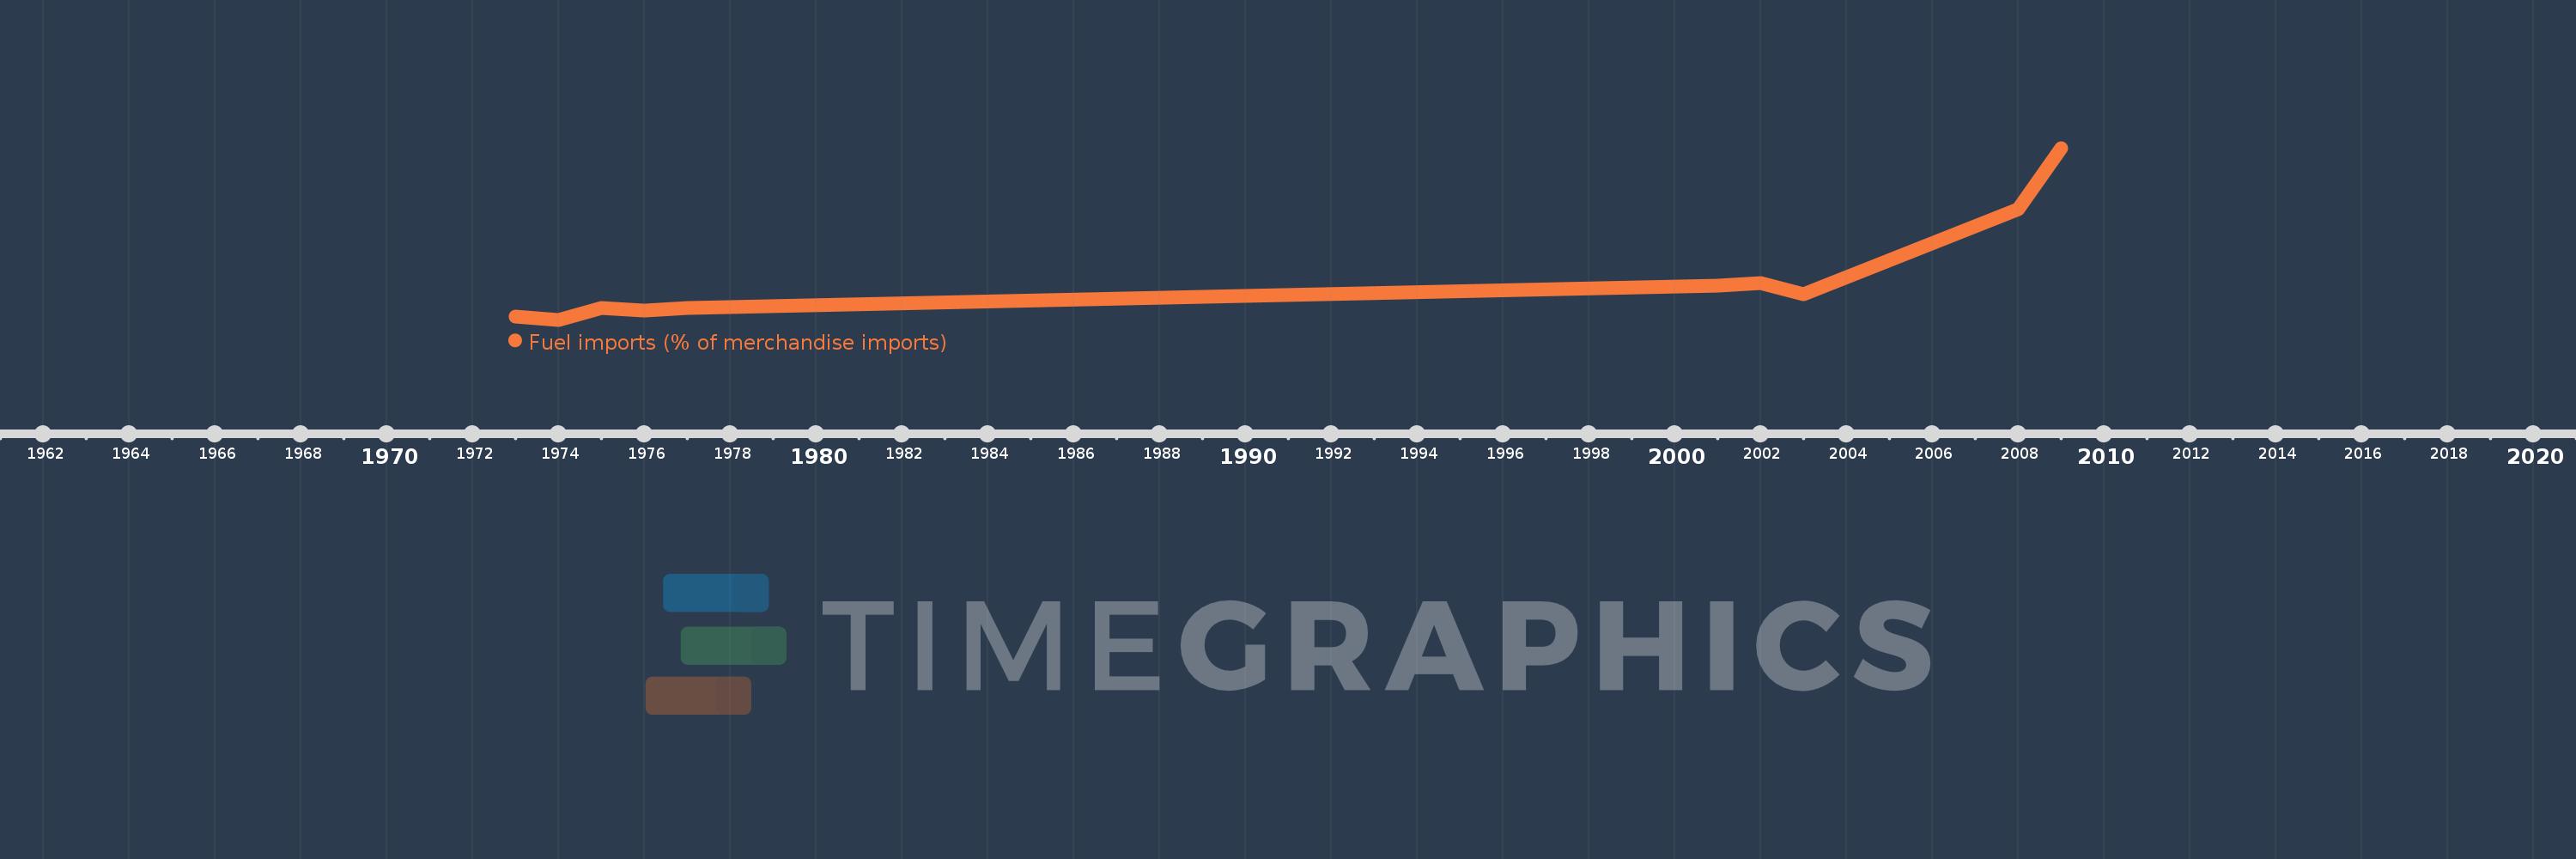
This timeline shows a graph from 1973 to 2009 of Fragile and conflict affected situations. No data until 1972. Number of actual observations by date: 10.
Source name:
World Development Indicators
Source organization:
World Bank staff estimates from the Comtrade database maintained by the United Nations Statistics Division.
Categories, topics:
Energy & Mining, Private Sector, Trade
Last updated:
apr 23, 2017
Indicators value changes by year
Meaning:
10.575
Minimum:
3.492
jan 1, 1974
Maximum:
32.842
jan 1, 2009
At the date of observation
Value
Absolute change
Change from the previous value
jan 1, 1973
4.066
+4.066
0.0%
jan 1, 1974
3.492
-0.574
-14.11%
jan 1, 1975
5.503
+2.011
57.6%
jan 1, 1976
5.064
-0.439
-7.99%
jan 1, 1977
5.507
+0.444
8.76%
jan 1, 2001
9.328
+3.821
69.38%
jan 1, 2002
9.752
+0.423
4.54%
jan 1, 2003
7.82
-1.932
-19.81%
jan 1, 2008
22.377
+14.557
186.16%
jan 1, 2009
32.842
+10.465
46.77%
Ranking of countries by current statistics by years