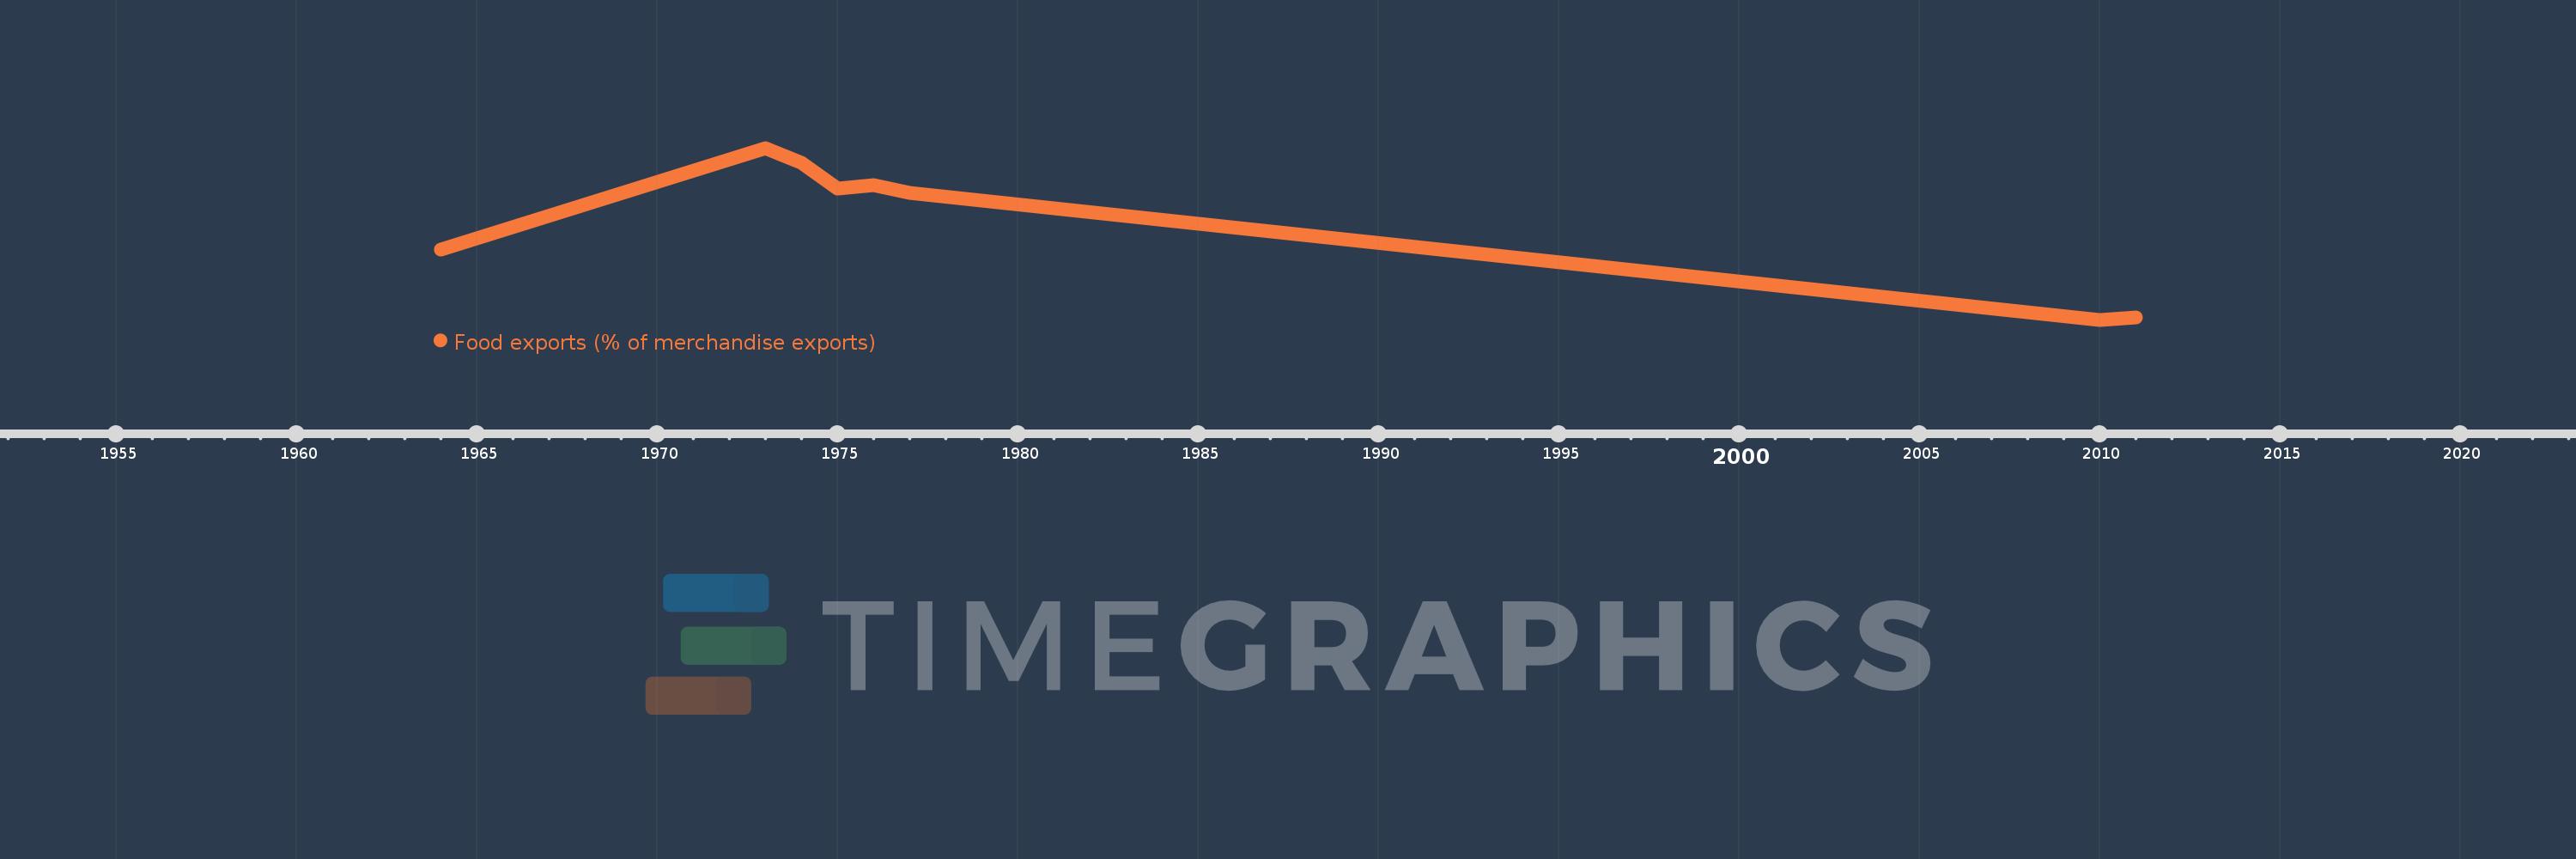
This timeline shows a graph from 1964 to 2011 of Fragile and conflict affected situations. No data until 1963. Number of actual observations by date: 8.
Source name:
World Development Indicators
Source organization:
World Bank staff estimates from the Comtrade database maintained by the United Nations Statistics Division.
Categories, topics:
Private Sector, Trade
Last updated:
apr 23, 2017
Indicators value changes by year
Meaning:
21.457
Minimum:
7.953
jan 1, 2010
Maximum:
31.341
jan 1, 1973
At the date of observation
Value
Absolute change
Change from the previous value
jan 1, 1964
17.539
+17.539
0.0%
jan 1, 1973
31.341
+13.802
78.69%
jan 1, 1974
29.349
-1.992
-6.36%
jan 1, 1975
25.777
-3.572
-12.17%
jan 1, 1976
26.249
+0.472
1.83%
jan 1, 1977
25.175
-1.074
-4.09%
jan 1, 2010
7.953
-17.222
-68.41%
jan 1, 2011
8.276
+0.323
4.06%
Ranking of countries by current statistics by years