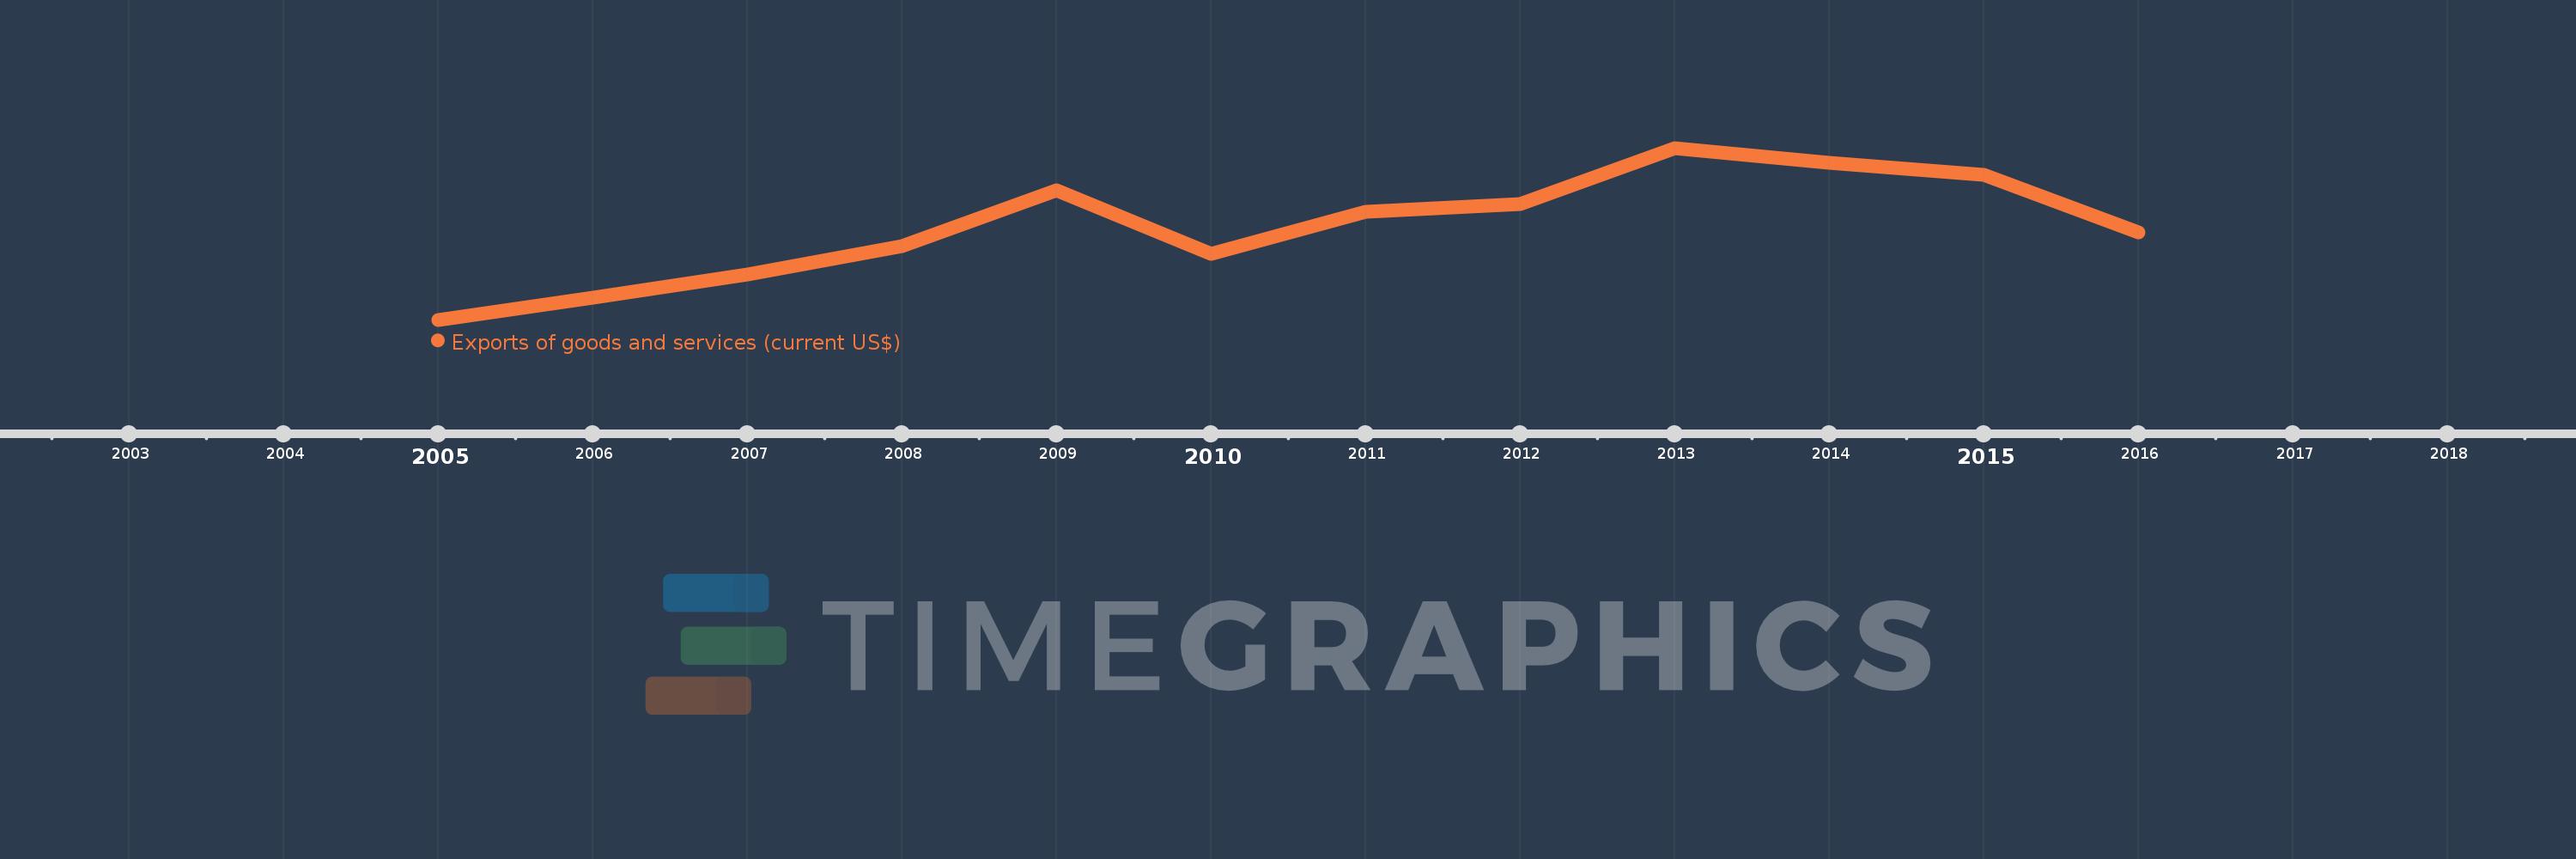
This timeline shows a graph from 2005 to 2016 of Fragile and conflict affected situations. No data until 2004. Number of actual observations by date: 12.
Source name:
World Development Indicators
Source organization:
World Bank national accounts data, and OECD National Accounts data files.
Categories, topics:
Economy & Growth, Trade
Last updated:
apr 23, 2017
Indicators value changes by year
Meaning:
196.585 bln
Minimum:
95.291 bln
jan 1, 2005
Maximum:
281.713 bln
jan 1, 2013
At the date of observation
Value
Absolute change
Change from the previous value
jan 1, 2005
95.291 bln
+95.291 bln
0.0%
jan 1, 2006
119.661 bln
+24.37 bln
25.57%
jan 1, 2007
144.226 bln
+24.564 bln
20.53%
jan 1, 2008
174.936 bln
+30.71 bln
21.29%
jan 1, 2009
235.422 bln
+60.487 bln
34.58%
jan 1, 2010
166.983 bln
-68.439 bln
-29.07%
jan 1, 2011
212.092 bln
+45.109 bln
27.01%
jan 1, 2012
220.596 bln
+8.504 bln
4.01%
jan 1, 2013
281.713 bln
+61.117 bln
27.71%
jan 1, 2014
265.311 bln
-16.402 bln
-5.82%
jan 1, 2015
252.844 bln
-12.467 bln
-4.7%
jan 1, 2016
189.937 bln
-62.906 bln
-24.88%
Ranking of countries by current statistics by years