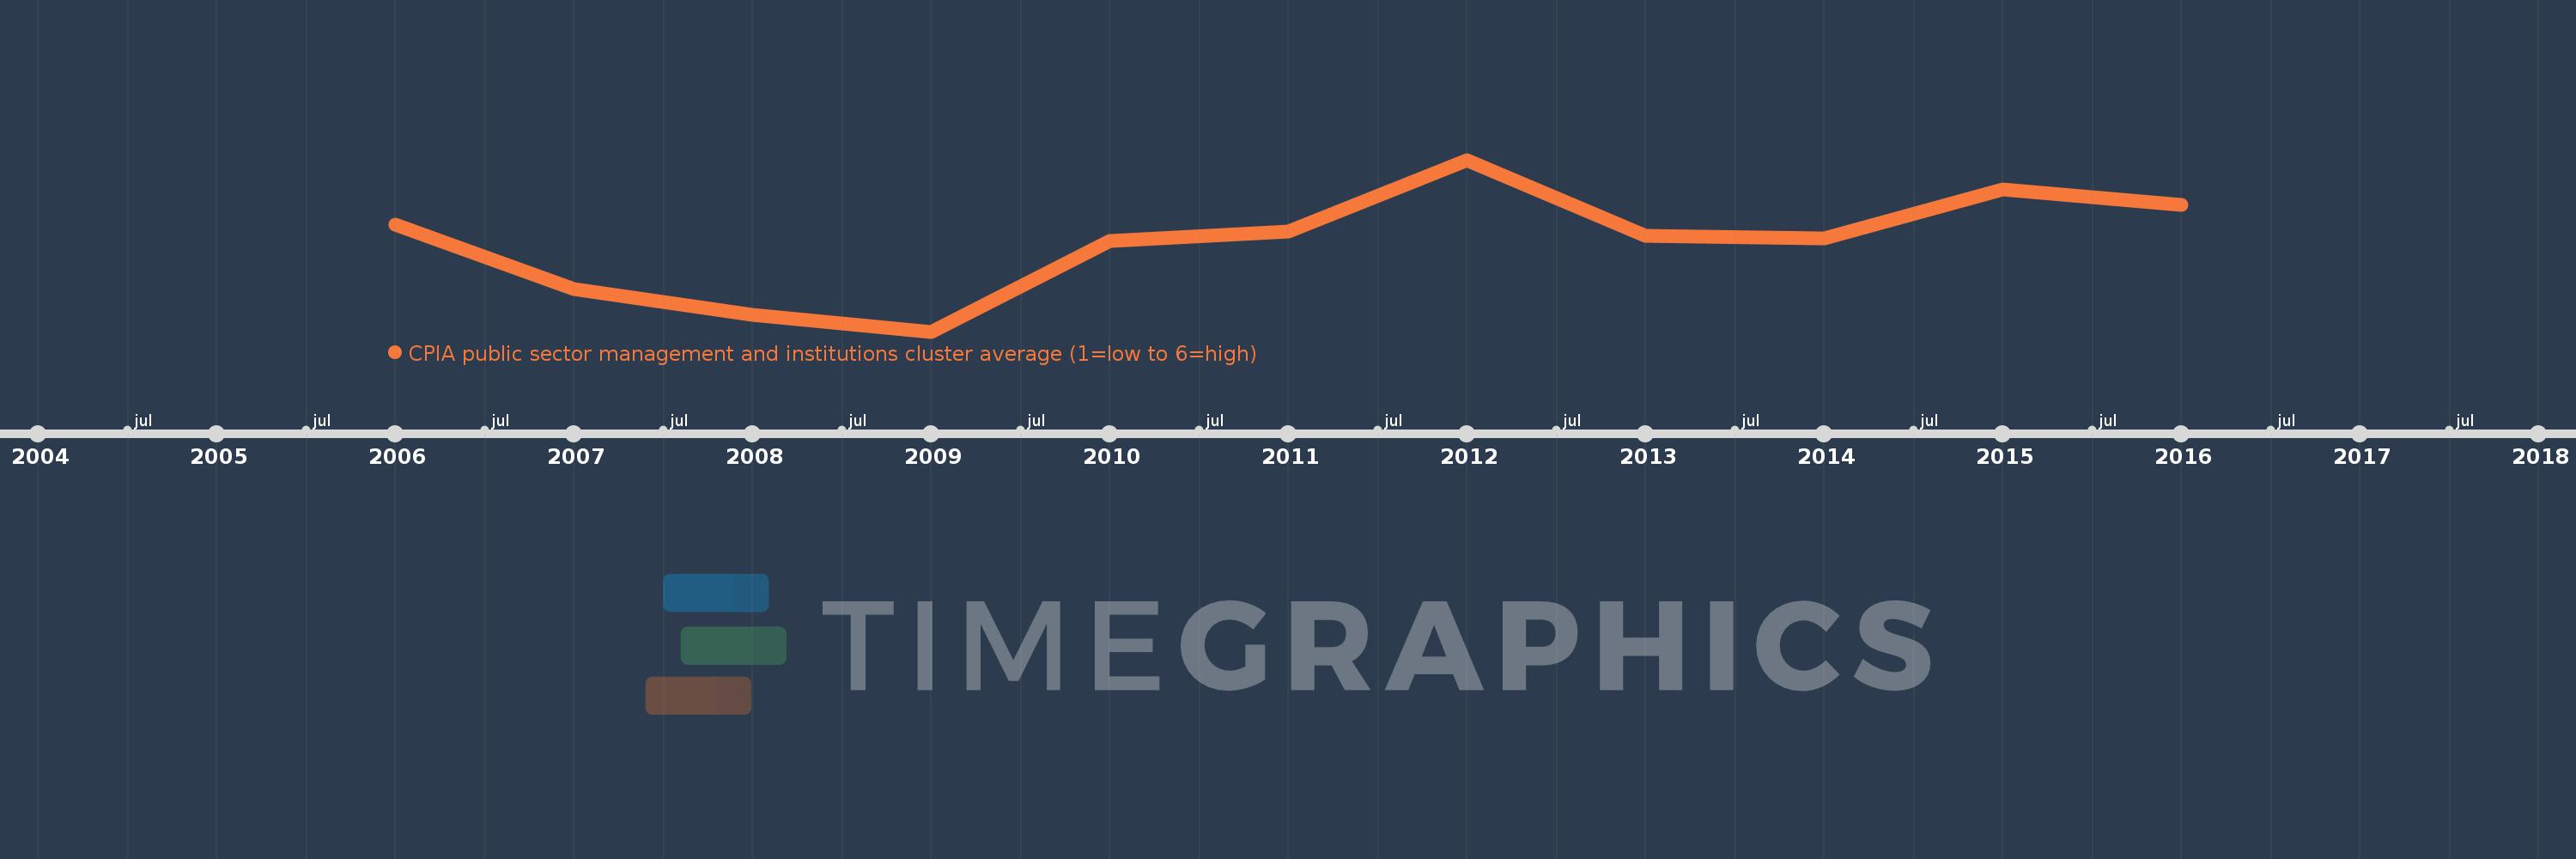
This timeline shows a graph from 2006 to 2016 of Fragile and conflict affected situations. No data until 2005. Number of actual observations by date: 11.
Source name:
World Development Indicators
Source organization:
World Bank Group, CPIA database (http://www.worldbank.org/ida).
Categories, topics:
Climate Change, Public Sector
Last updated:
apr 23, 2017
Indicators value changes by year
Meaning:
2.666
Minimum:
2.591
jan 1, 2009
Maximum:
2.735
jan 1, 2012
At the date of observation
Value
Absolute change
Change from the previous value
jan 1, 2006
2.681
+2.681
0.0%
jan 1, 2007
2.627
-0.054
-2.0%
jan 1, 2008
2.605
-0.023
-0.87%
jan 1, 2009
2.591
-0.014
-0.52%
jan 1, 2010
2.667
+0.076
2.92%
jan 1, 2011
2.675
+0.008
0.31%
jan 1, 2012
2.735
+0.06
2.23%
jan 1, 2013
2.671
-0.063
-2.31%
jan 1, 2014
2.669
-0.002
-0.09%
jan 1, 2015
2.71
+0.041
1.55%
jan 1, 2016
2.697
-0.014
-0.51%
Ranking of countries by current statistics by years