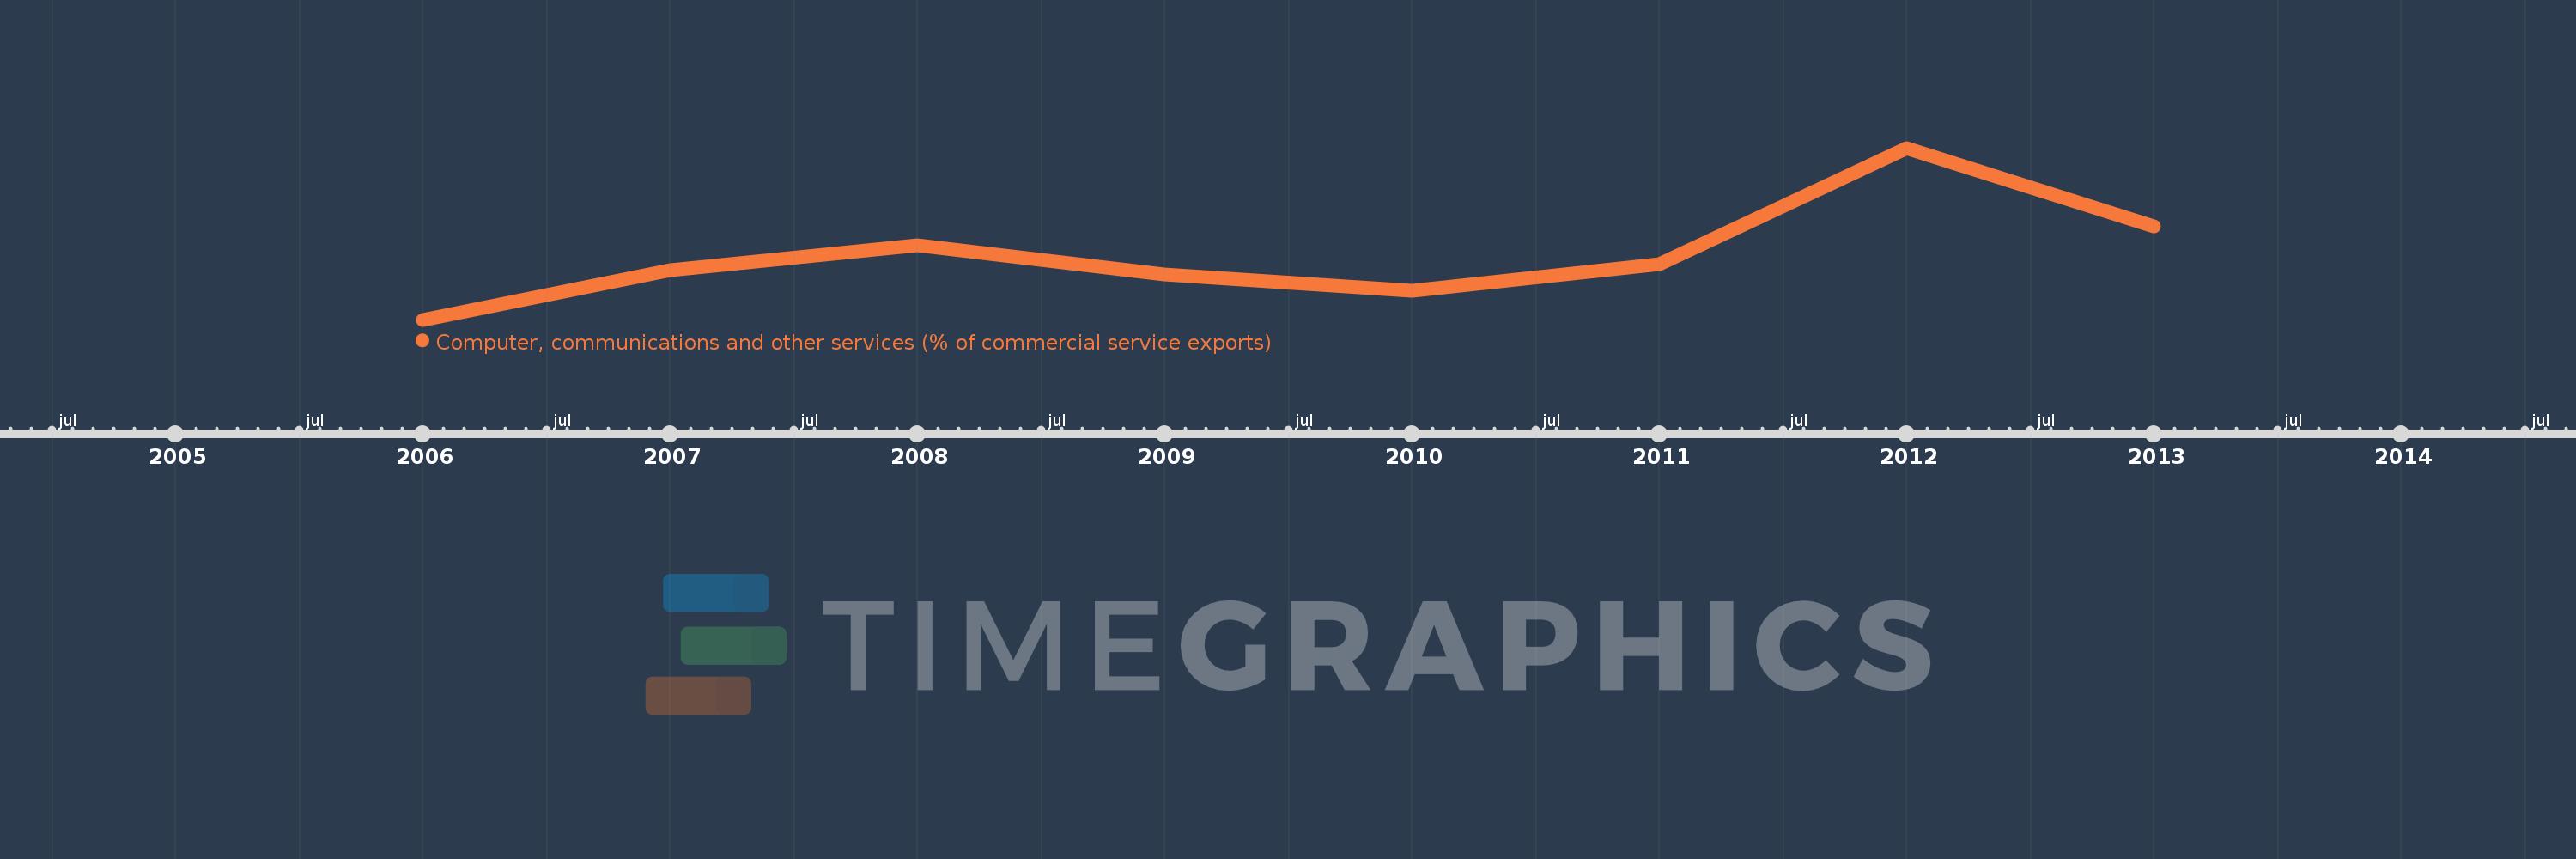
This timeline shows a graph from 2006 to 2013 of Fragile and conflict affected situations. No data until 2005. Number of actual observations by date: 8.
Source name:
World Development Indicators
Source organization:
International Monetary Fund, Balance of Payments Statistics Yearbook and data files.
Categories, topics:
Private Sector, Trade
Last updated:
apr 23, 2017
Indicators value changes by year
Meaning:
18.548
Minimum:
15.118
jan 1, 2006
Maximum:
24.207
jan 1, 2012
At the date of observation
Value
Absolute change
Change from the previous value
jan 1, 2006
15.118
+15.118
0.0%
jan 1, 2007
17.734
+2.616
17.3%
jan 1, 2008
19.036
+1.303
7.35%
jan 1, 2009
17.534
-1.502
-7.89%
jan 1, 2010
16.643
-0.891
-5.08%
jan 1, 2011
18.058
+1.415
8.5%
jan 1, 2012
24.207
+6.149
34.05%
jan 1, 2013
20.05
-4.157
-17.17%
Ranking of countries by current statistics by years