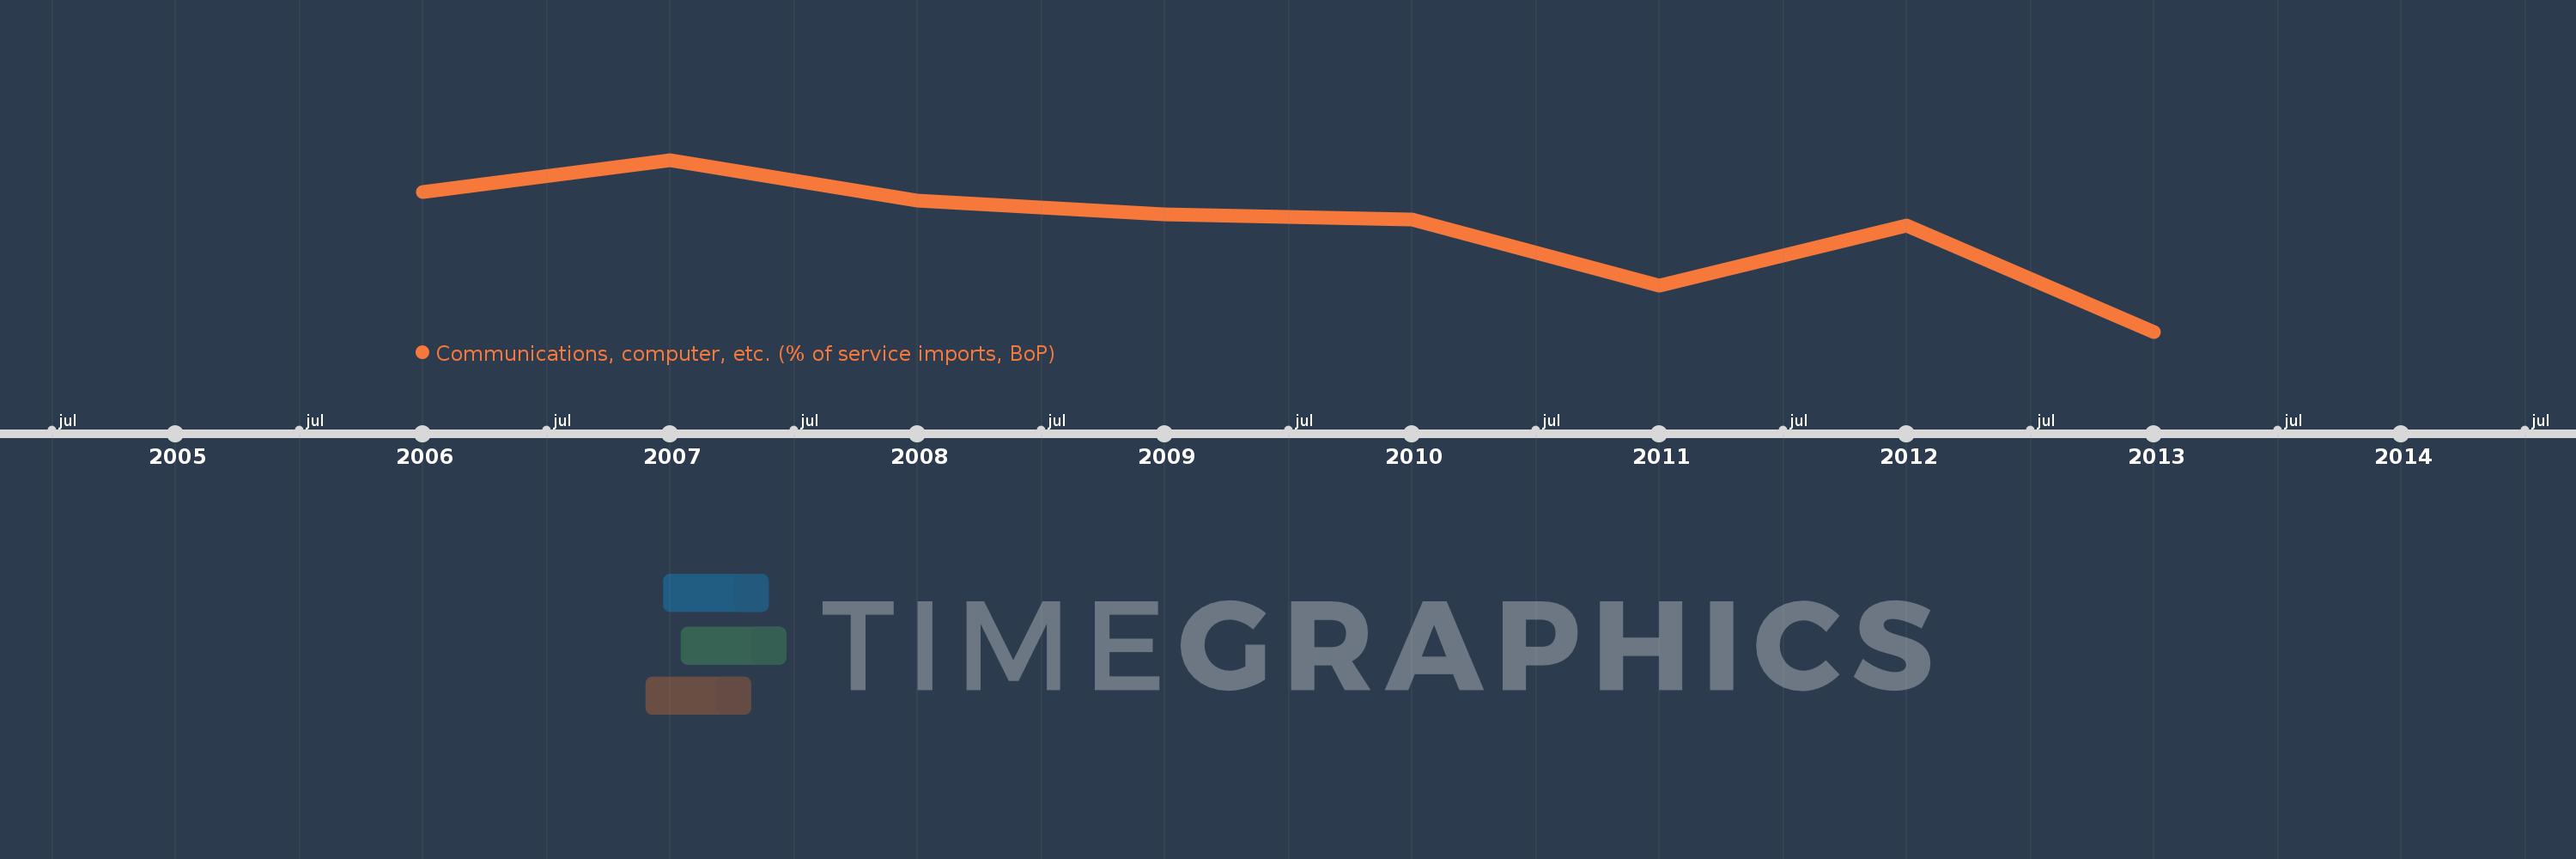
This timeline shows a graph from 2006 to 2013 of Fragile and conflict affected situations. No data until 2005. Number of actual observations by date: 8.
Source name:
World Development Indicators
Source organization:
International Monetary Fund, Balance of Payments Statistics Yearbook and data files.
Categories, topics:
Economy & Growth, Trade
Last updated:
apr 23, 2017
Indicators value changes by year
Meaning:
31.301
Minimum:
25.054
jan 1, 2013
Maximum:
35.472
jan 1, 2007
At the date of observation
Value
Absolute change
Change from the previous value
jan 1, 2006
33.521
+33.521
0.0%
jan 1, 2007
35.472
+1.951
5.82%
jan 1, 2008
33.018
-2.454
-6.92%
jan 1, 2009
32.14
-0.878
-2.66%
jan 1, 2010
31.846
-0.294
-0.91%
jan 1, 2011
27.862
-3.983
-12.51%
jan 1, 2012
31.495
+3.633
13.04%
jan 1, 2013
25.054
-6.441
-20.45%
Ranking of countries by current statistics by years