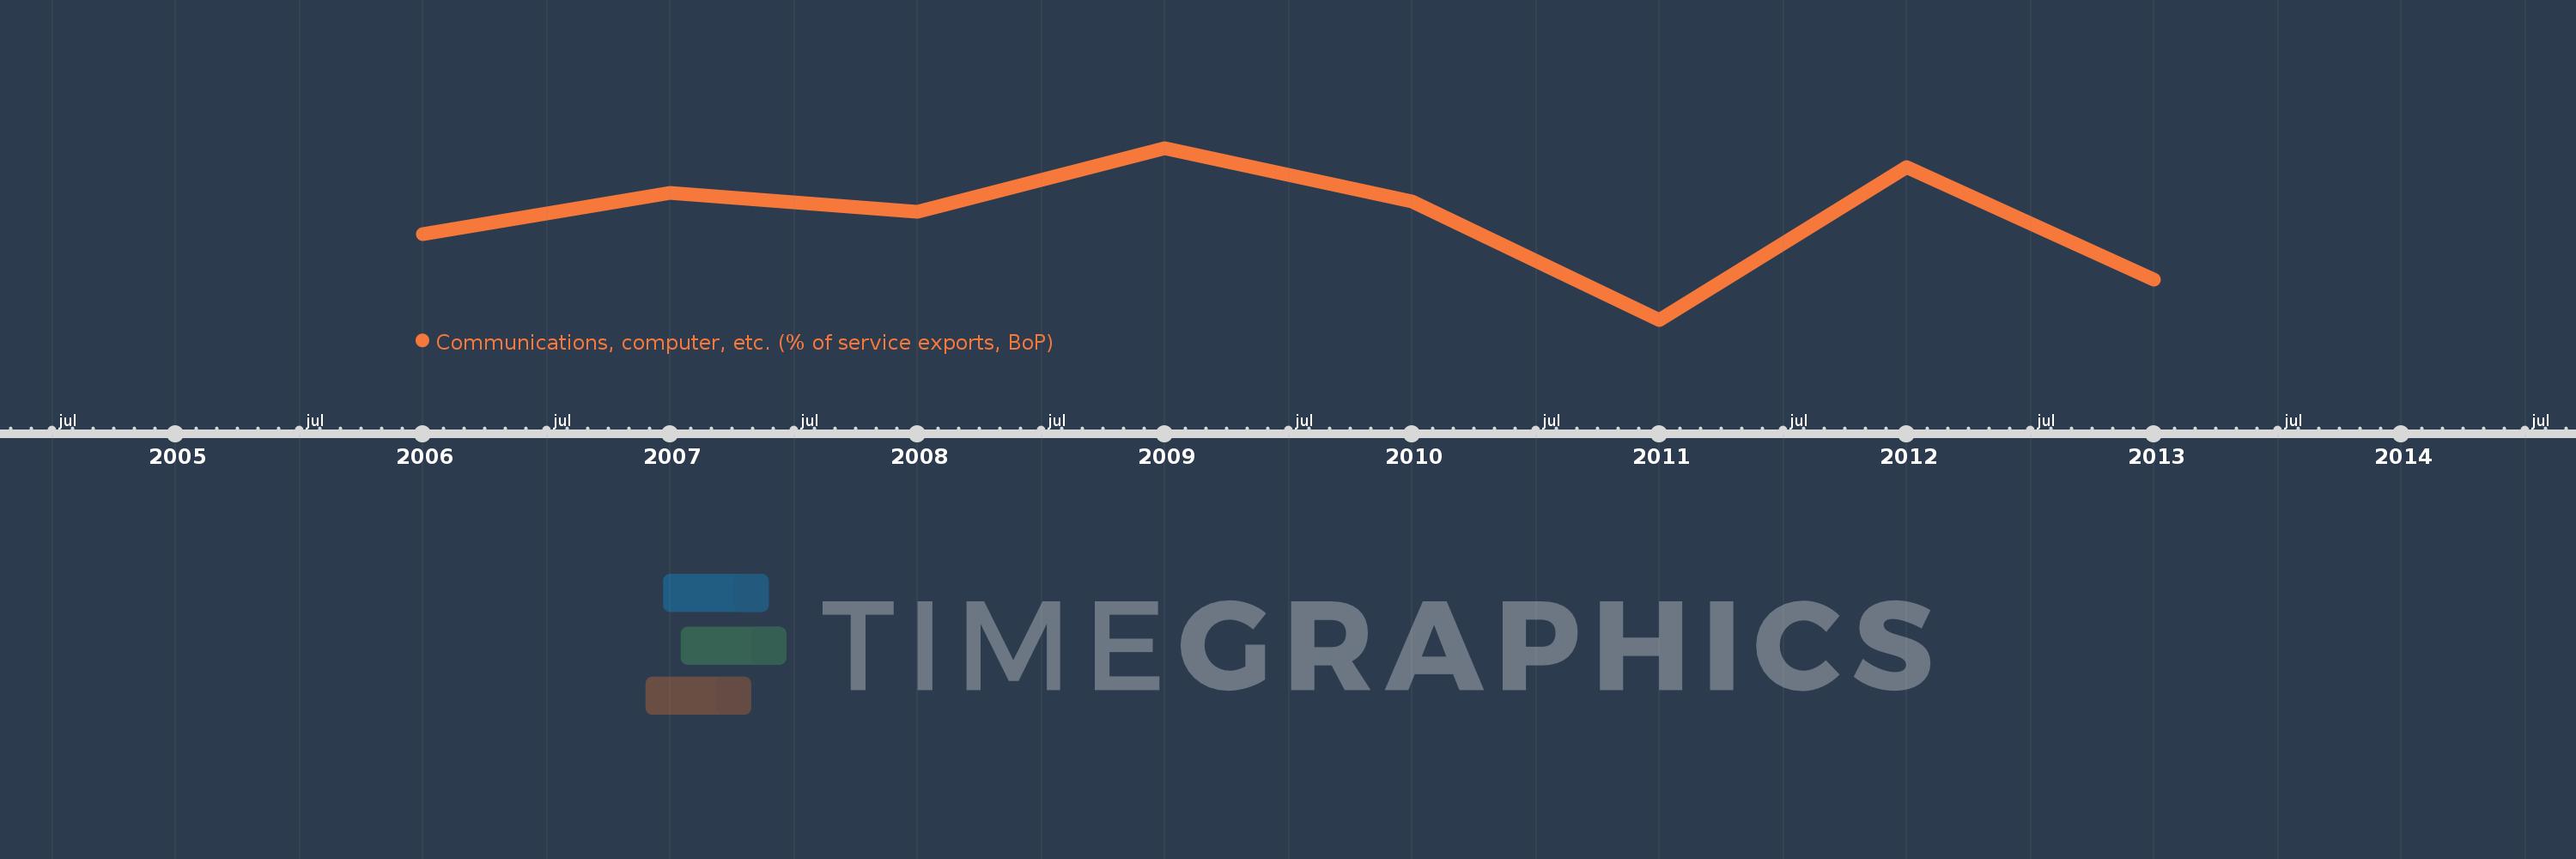
This timeline shows a graph from 2006 to 2013 of Fragile and conflict affected situations. No data until 2005. Number of actual observations by date: 8.
Source name:
World Development Indicators
Source organization:
International Monetary Fund, Balance of Payments Statistics Yearbook and data files.
Categories, topics:
Economy & Growth, Trade
Last updated:
apr 23, 2017
Indicators value changes by year
Meaning:
42.815
Minimum:
31.564
jan 1, 2011
Maximum:
50.803
jan 1, 2009
At the date of observation
Value
Absolute change
Change from the previous value
jan 1, 2006
41.152
+41.152
0.0%
jan 1, 2007
45.8
+4.649
11.3%
jan 1, 2008
43.619
-2.182
-4.76%
jan 1, 2009
50.803
+7.184
16.47%
jan 1, 2010
44.845
-5.958
-11.73%
jan 1, 2011
31.564
-13.281
-29.62%
jan 1, 2012
48.658
+17.094
54.16%
jan 1, 2013
36.079
-12.579
-25.85%
Ranking of countries by current statistics by years