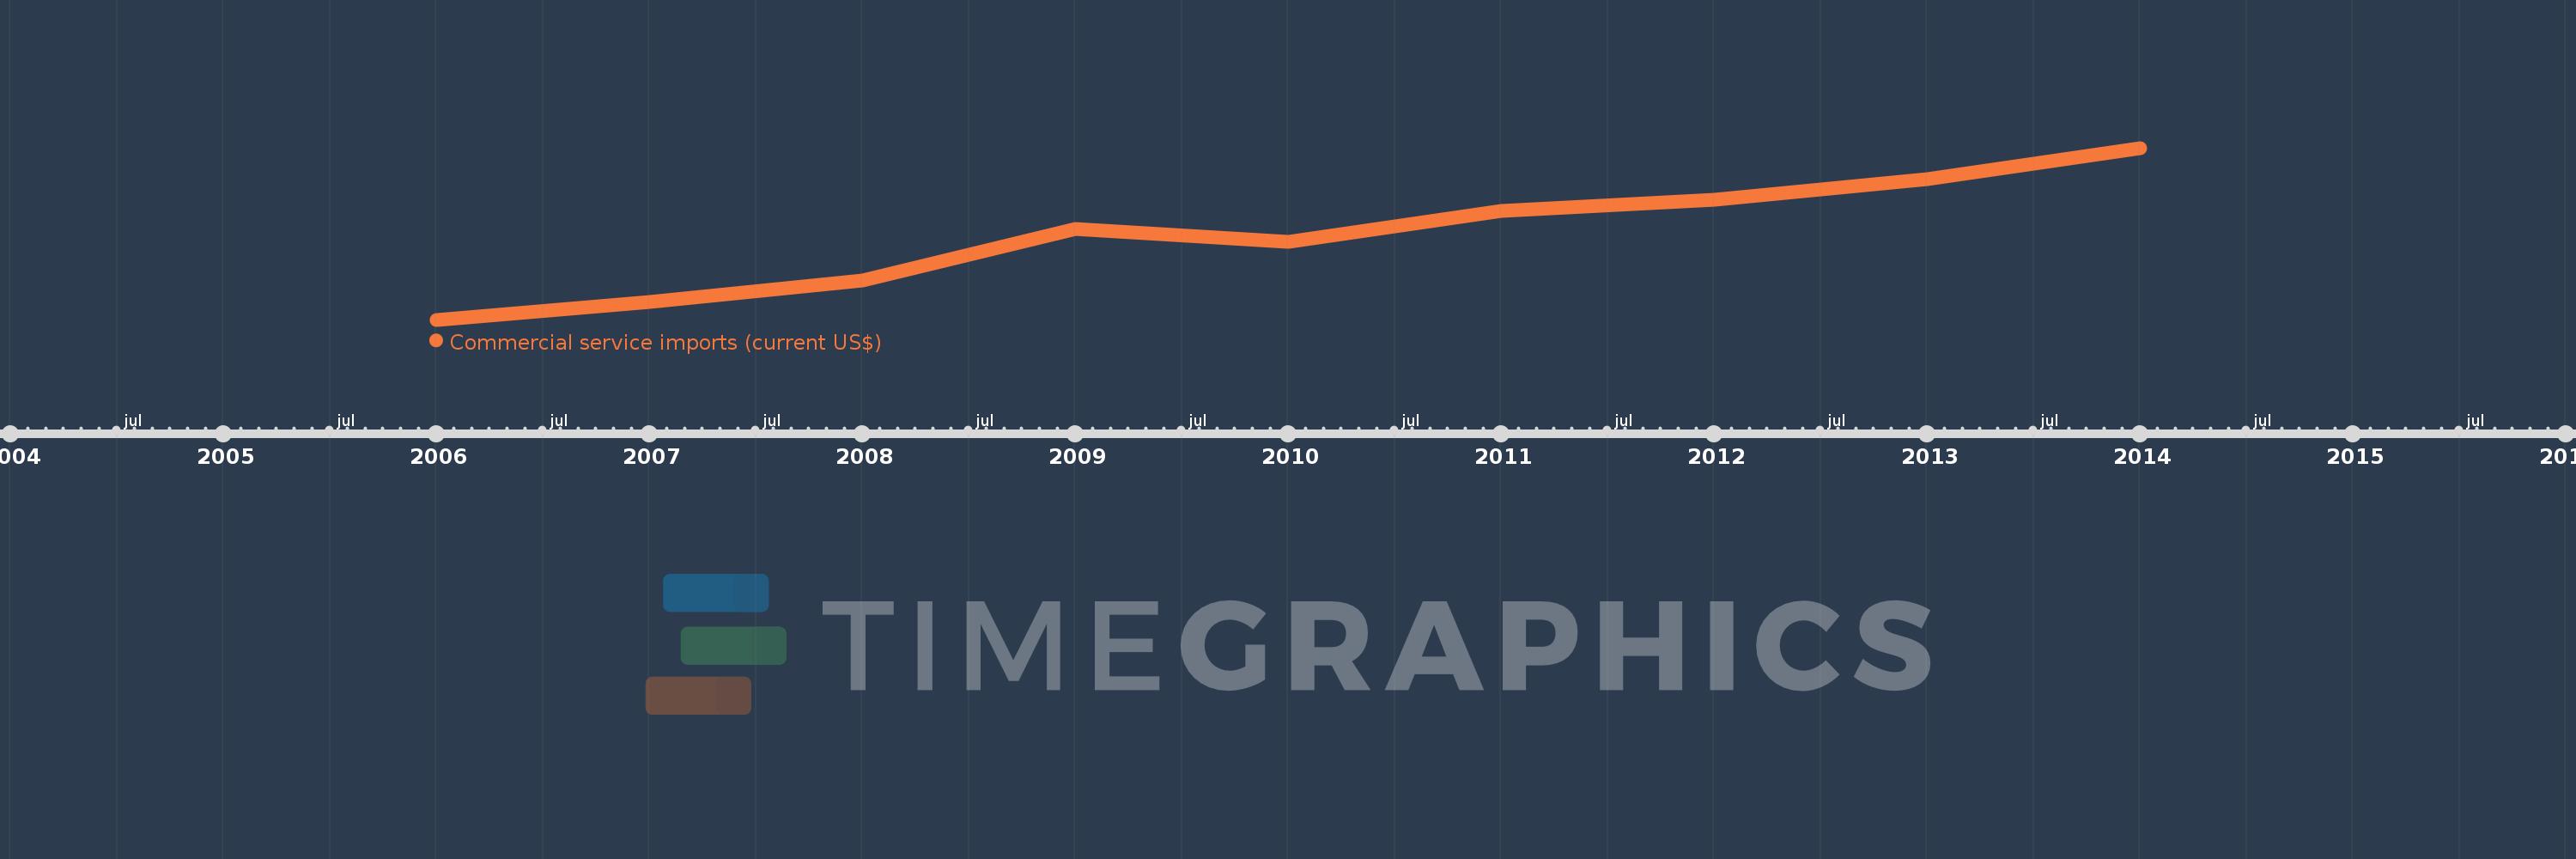
This timeline shows a graph from 2006 to 2014 of Fragile and conflict affected situations. No data until 2005. Number of actual observations by date: 9.
Source name:
World Development Indicators
Source organization:
International Monetary Fund, Balance of Payments Statistics Yearbook and data files.
Categories, topics:
Private Sector, Trade
Last updated:
apr 23, 2017
Indicators value changes by year
Meaning:
50.705 bln
Minimum:
33.084 bln
jan 1, 2006
Maximum:
68.578 bln
jan 1, 2014
At the date of observation
Value
Absolute change
Change from the previous value
jan 1, 2006
33.084 bln
+33.084 bln
0.0%
jan 1, 2007
36.777 bln
+3.693 bln
11.16%
jan 1, 2008
41.209 bln
+4.433 bln
12.05%
jan 1, 2009
51.812 bln
+10.603 bln
25.73%
jan 1, 2010
49.123 bln
-2.689 bln
-5.19%
jan 1, 2011
55.614 bln
+6.491 bln
13.21%
jan 1, 2012
57.936 bln
+2.322 bln
4.17%
jan 1, 2013
62.209 bln
+4.273 bln
7.37%
jan 1, 2014
68.578 bln
+6.369 bln
10.24%
Ranking of countries by current statistics by years