33
/
AIzaSyB4mHJ5NPEv-XzF7P6NDYXjlkCWaeKw5bc
November 30, 2025
34070
Fragile and conflict affected situations
FCS
false
2
1
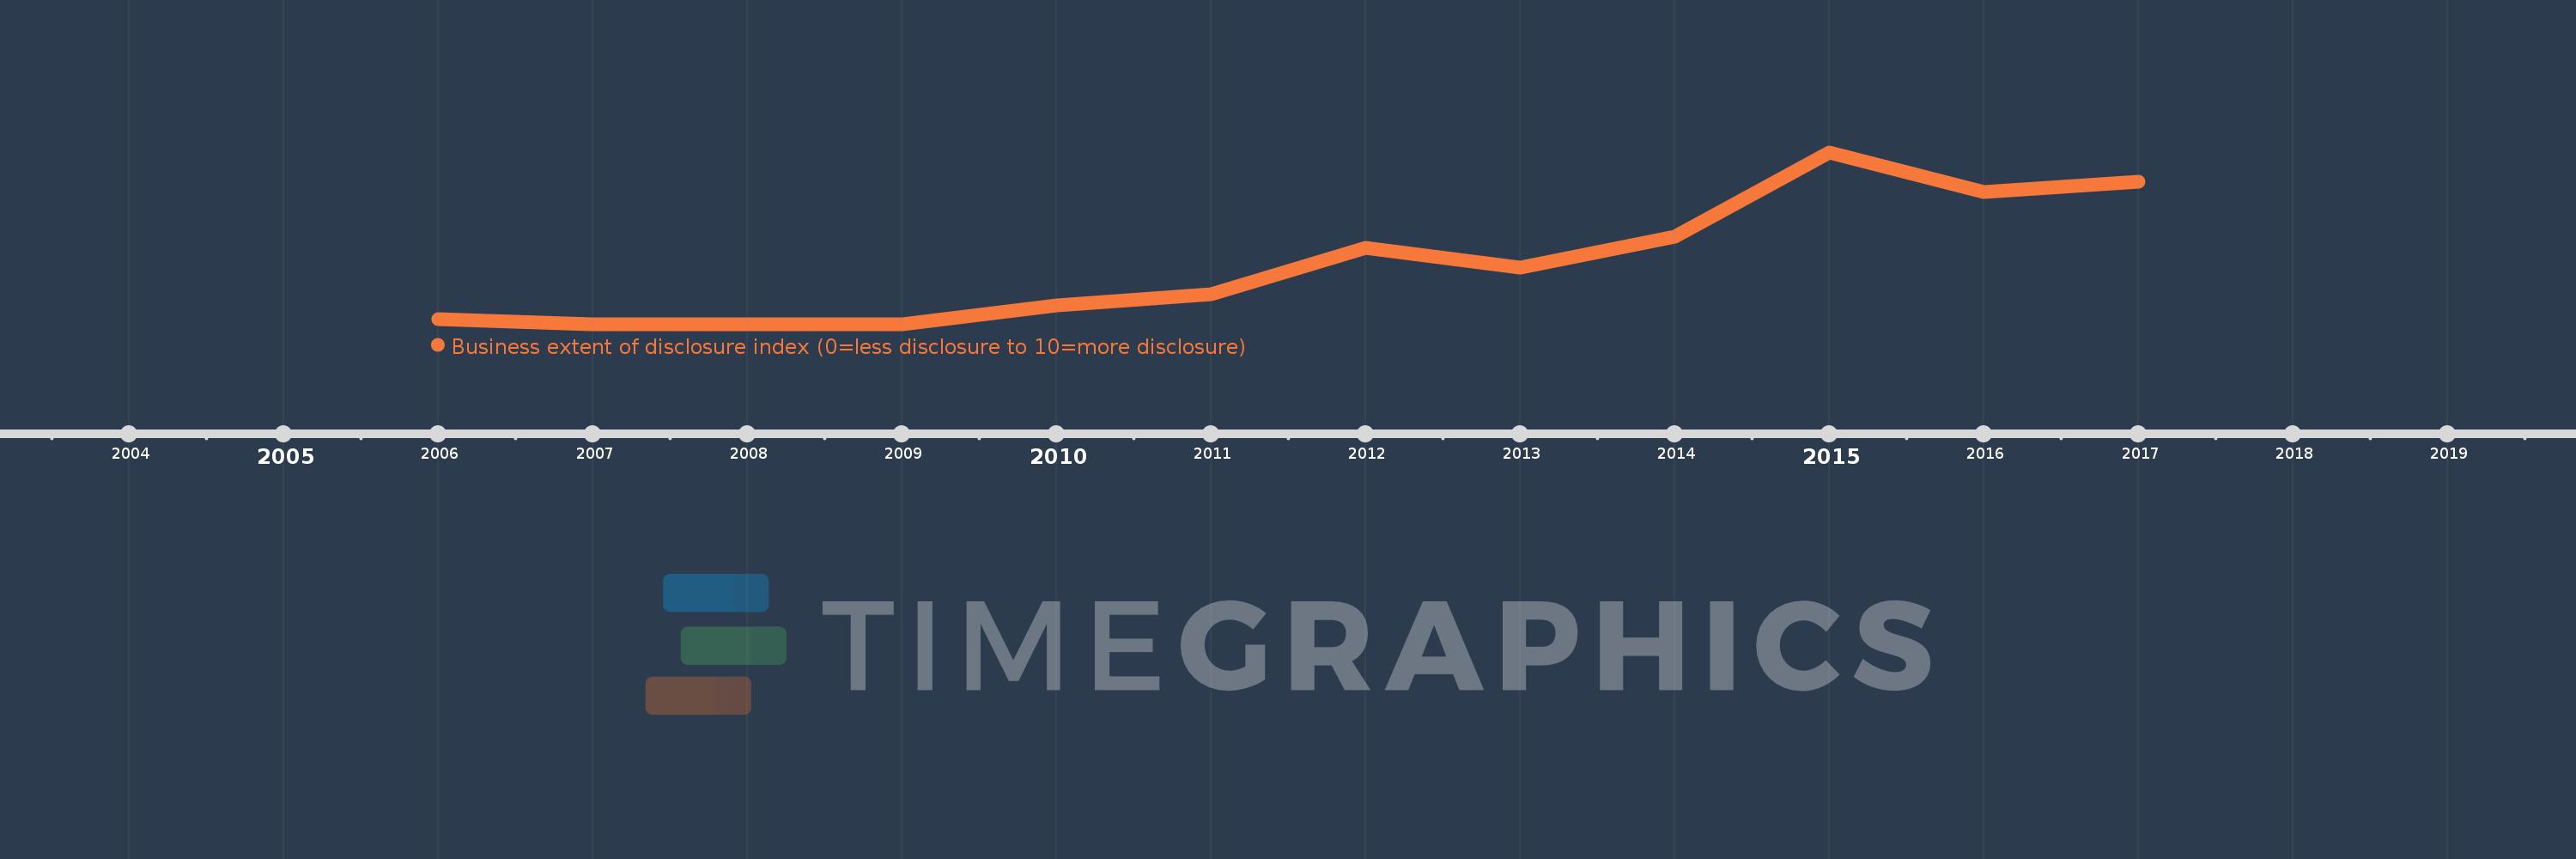
Business extent of disclosure index (0=less disclosure to 10=more disclosure)
2017,2016,2015,2014,2013,2012,2011,2010,2009,2008,2007,2006