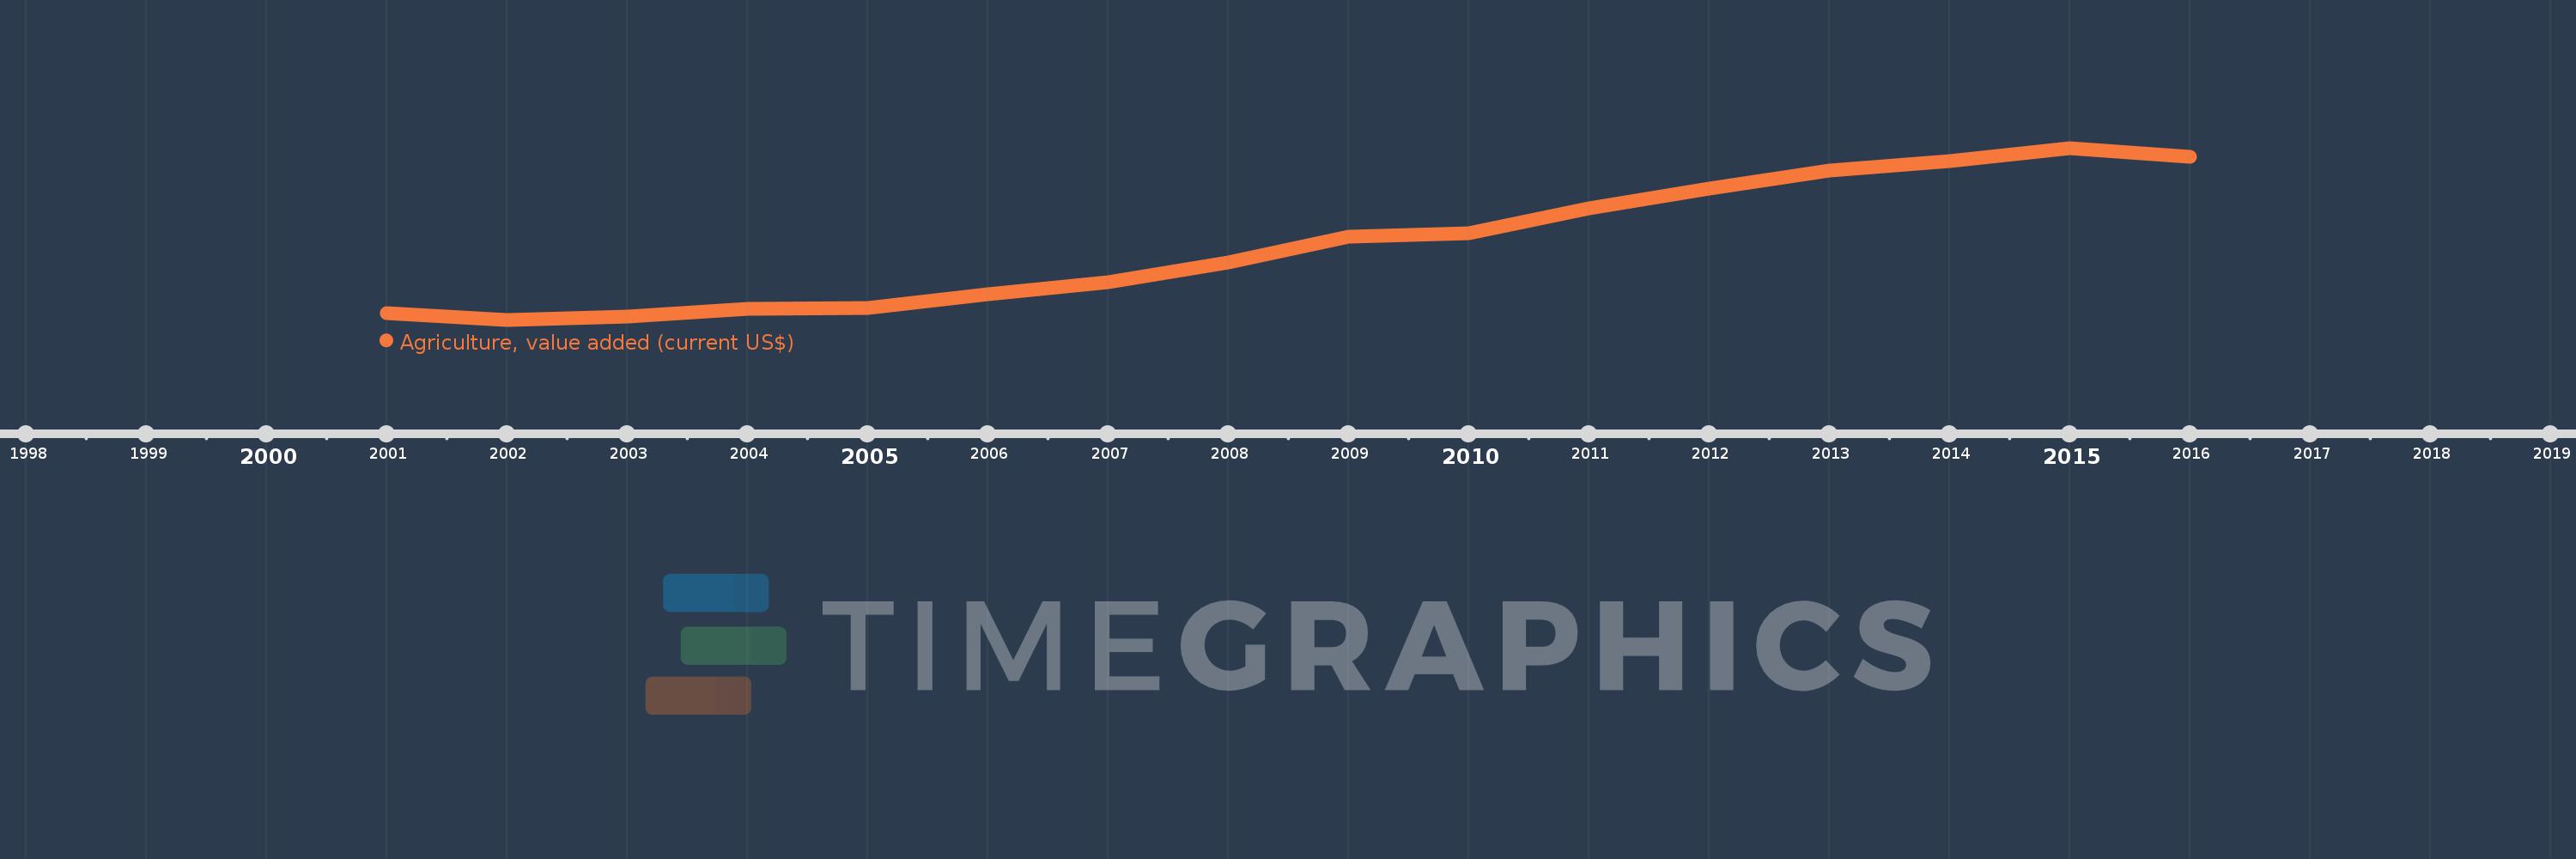
This timeline shows a graph from 2001 to 2016 of Fragile and conflict affected situations. No data until 2000. Number of actual observations by date: 16.
Source name:
World Development Indicators
Source organization:
World Bank national accounts data, and OECD National Accounts data files.
Categories, topics:
Agriculture & Rural Development, Economy & Growth
Last updated:
apr 23, 2017
Indicators value changes by year
Meaning:
78.661 bln
Minimum:
36.72 bln
jan 1, 2002
Maximum:
132.011 bln
jan 1, 2015
At the date of observation
Value
Absolute change
Change from the previous value
jan 1, 2001
40.498 bln
+40.498 bln
0.0%
jan 1, 2002
36.72 bln
-3.778 bln
-9.33%
jan 1, 2003
38.301 bln
+1.58 bln
4.3%
jan 1, 2004
42.776 bln
+4.475 bln
11.68%
jan 1, 2005
43.26 bln
+484.322 mln
1.13%
jan 1, 2006
51.011 bln
+7.751 bln
17.92%
jan 1, 2007
57.746 bln
+6.735 bln
13.2%
jan 1, 2008
68.707 bln
+10.961 bln
18.98%
jan 1, 2009
82.779 bln
+14.072 bln
20.48%
jan 1, 2010
84.789 bln
+2.01 bln
2.43%
jan 1, 2011
98.717 bln
+13.928 bln
16.43%
jan 1, 2012
109.524 bln
+10.807 bln
10.95%
jan 1, 2013
119.573 bln
+10.049 bln
9.18%
jan 1, 2014
124.838 bln
+5.265 bln
4.4%
jan 1, 2015
132.011 bln
+7.172 bln
5.75%
jan 1, 2016
127.328 bln
-4.683 bln
-3.55%
Ranking of countries by current statistics by years