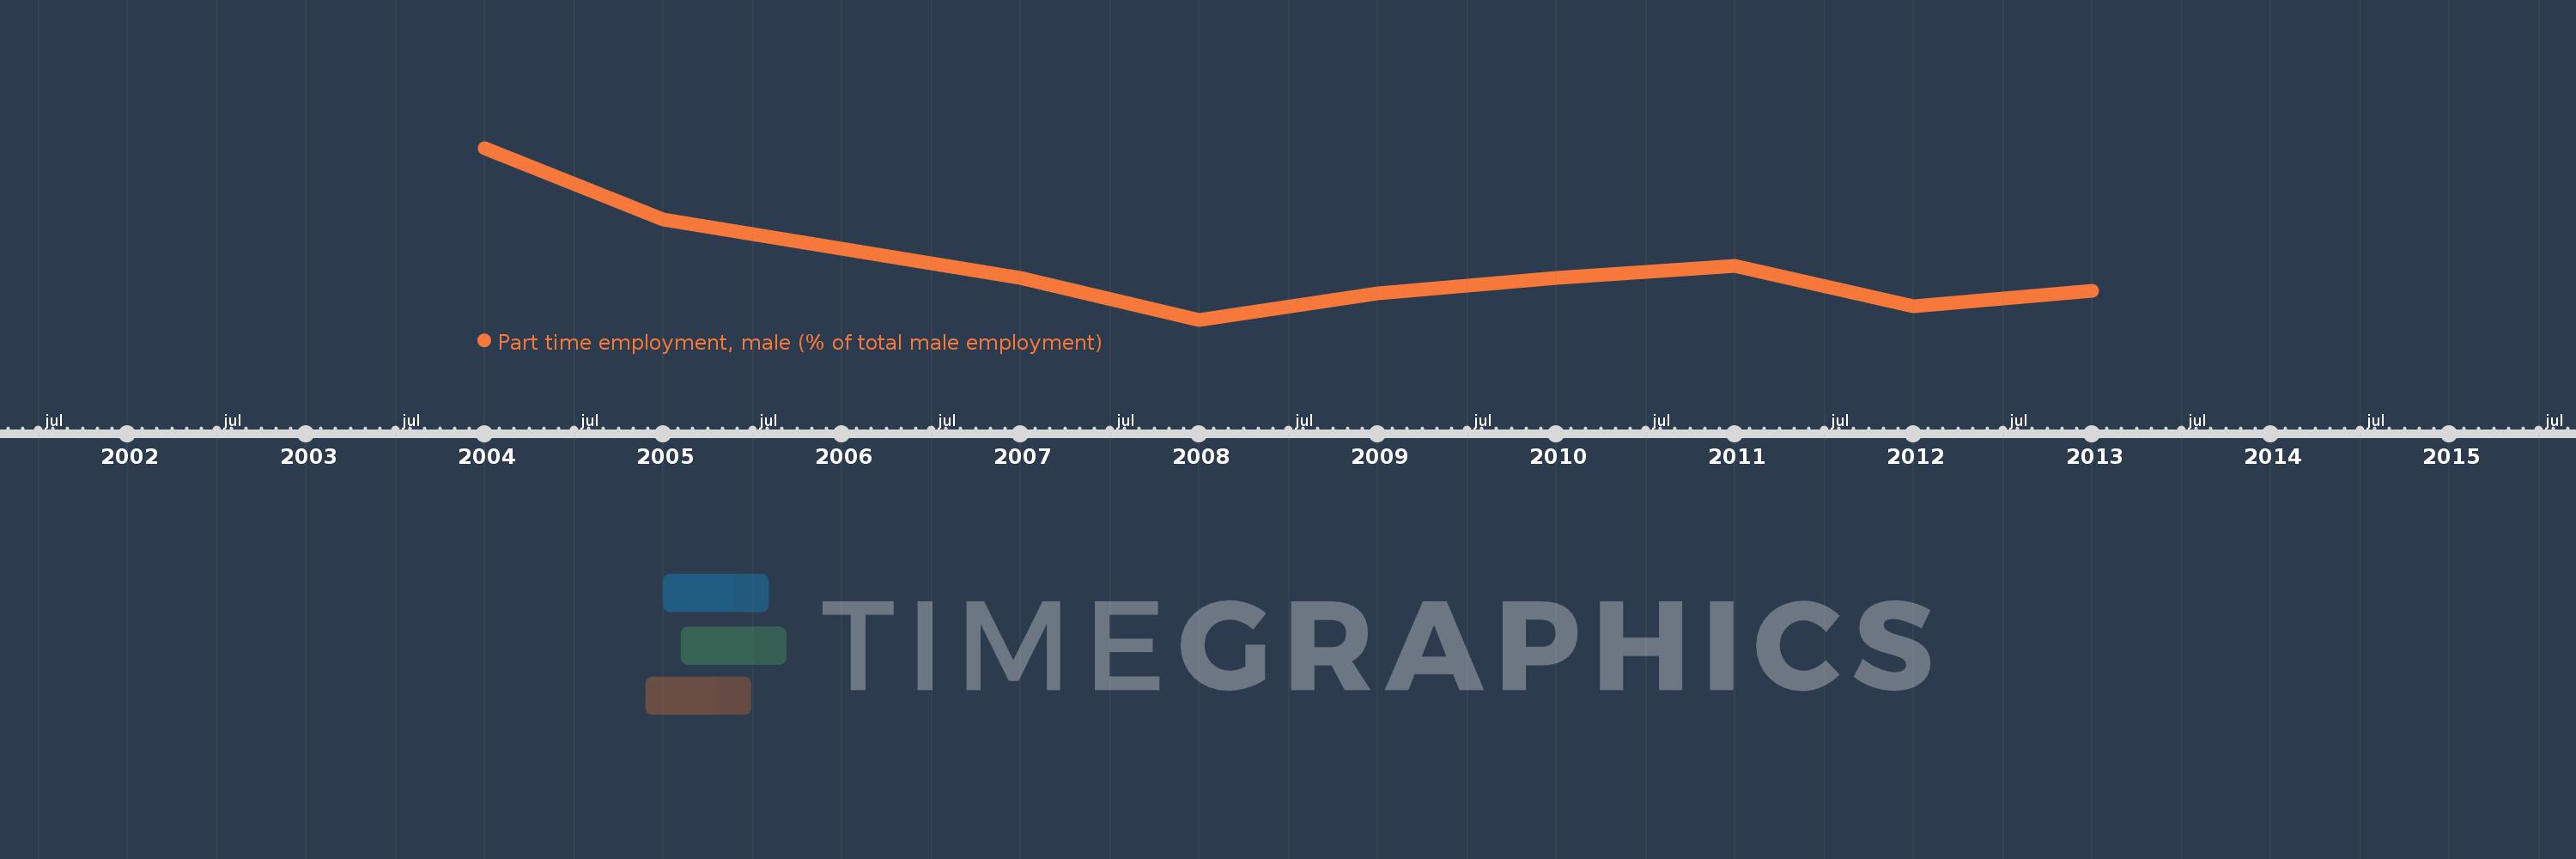
This timeline shows a graph from 2004 to 2013 of Europe & Central Asia (IDA & IBRD countries). No data until 2003. Number of actual observations by date: 9.
Source name:
World Development Indicators
Source organization:
International Labour Organization, Key Indicators of the Labour Market database.
Categories, topics:
Social Protection & Labor, Gender
Last updated:
apr 23, 2017
Indicators value changes by year
Meaning:
4.886
Minimum:
4.596
jan 1, 2008
Maximum:
5.532
jan 1, 2004
At the date of observation
Value
Absolute change
Change from the previous value
jan 1, 2004
5.532
+5.532
0.0%
jan 1, 2005
5.144
-0.388
-7.01%
jan 1, 2007
4.825
-0.319
-6.21%
jan 1, 2008
4.596
-0.229
-4.75%
jan 1, 2009
4.741
+0.145
3.17%
jan 1, 2010
4.822
+0.081
1.71%
jan 1, 2011
4.891
+0.069
1.43%
jan 1, 2012
4.668
-0.223
-4.56%
jan 1, 2013
4.754
+0.086
1.83%
Ranking of countries by current statistics by years