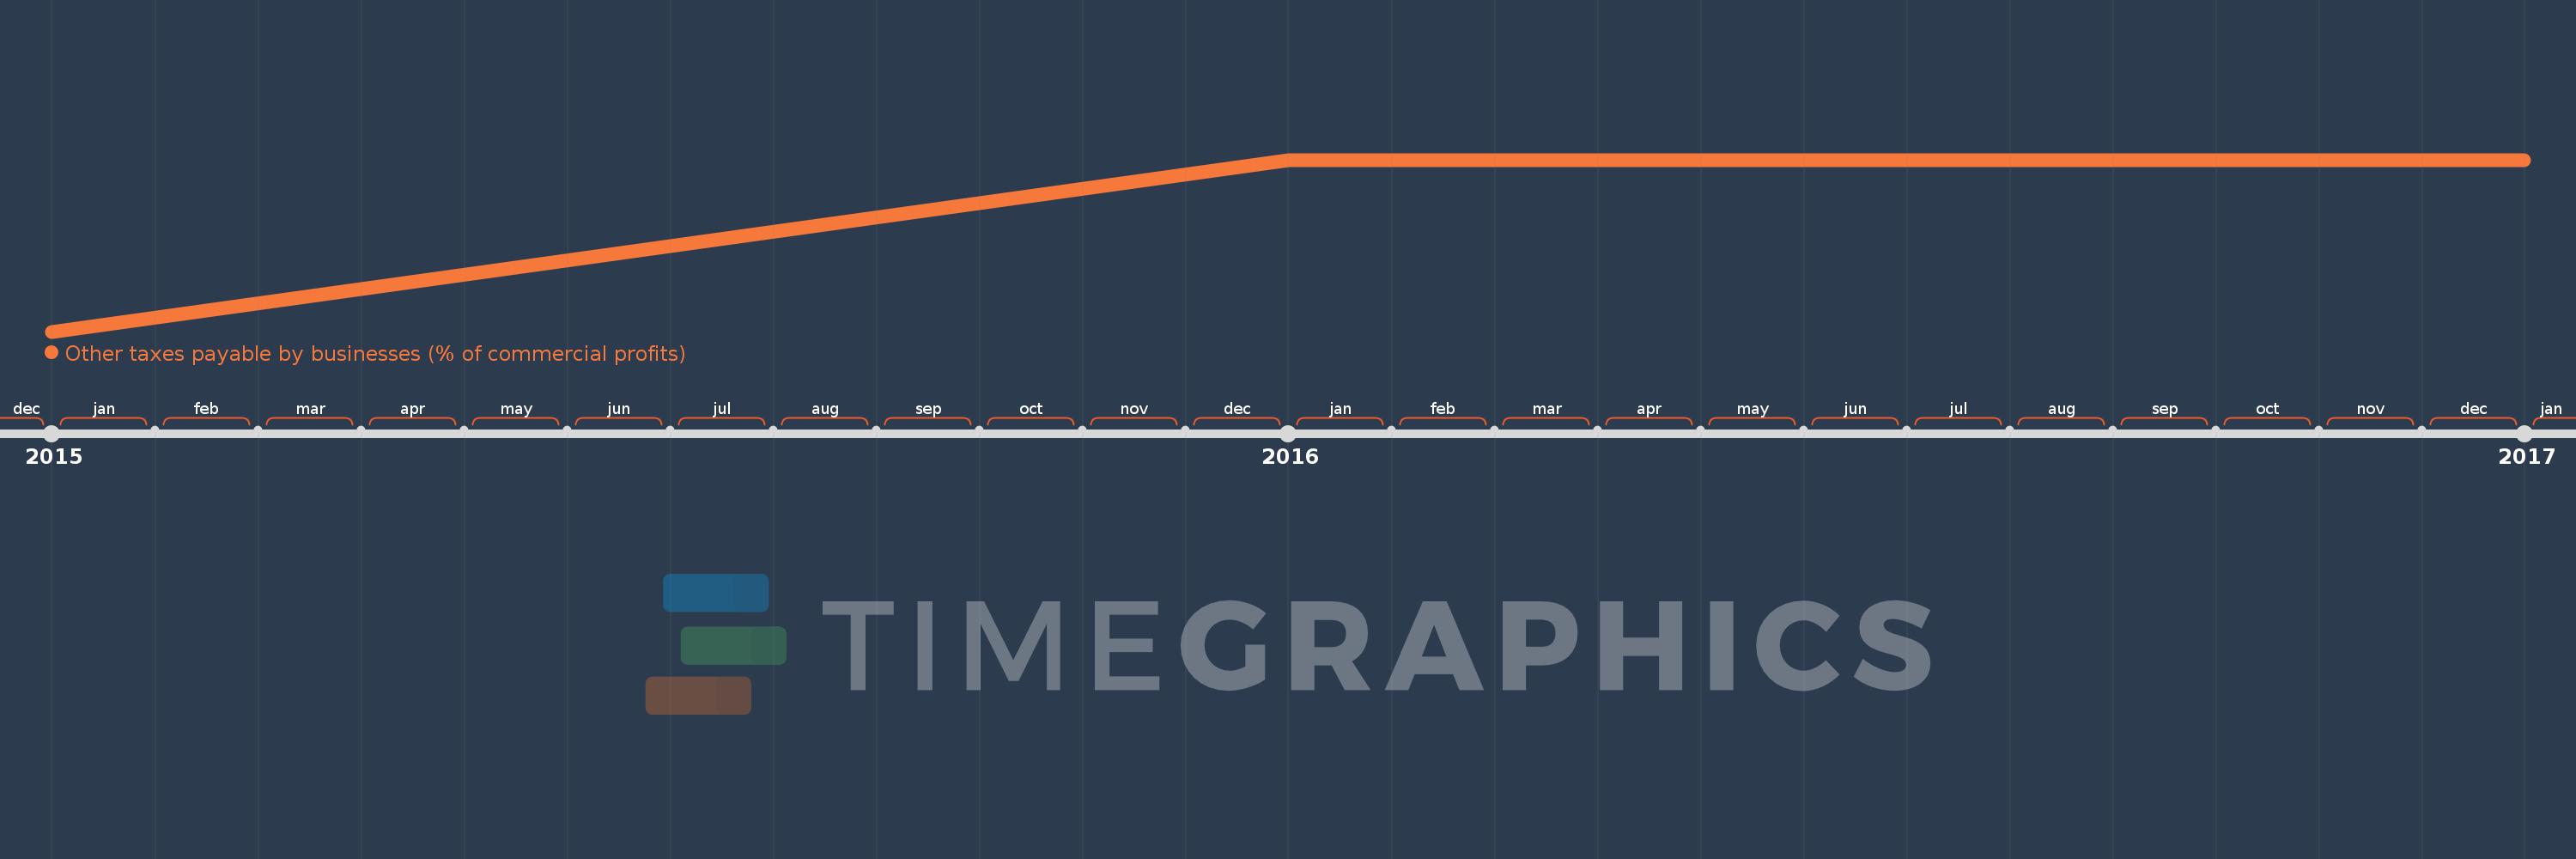
This timeline shows a graph from 2015 to 2017 of Europe & Central Asia (IDA & IBRD countries). No data until 2014. Number of actual observations by date: 3.
Source name:
World Development Indicators
Source organization:
World Bank, Doing Business project (http://www.doingbusiness.org/).
Categories, topics:
Private Sector
Last updated:
apr 23, 2017
Indicators value changes by year
Meaning:
3.27
Minimum:
3.21
jan 1, 2015
Maximum:
3.3
jan 1, 2016
At the date of observation
Value
Absolute change
Change from the previous value
jan 1, 2015
3.21
+3.21
0.0%
jan 1, 2016
3.3
+0.09
2.82%
jan 1, 2017
3.3
0.0
0.0%
Ranking of countries by current statistics by years