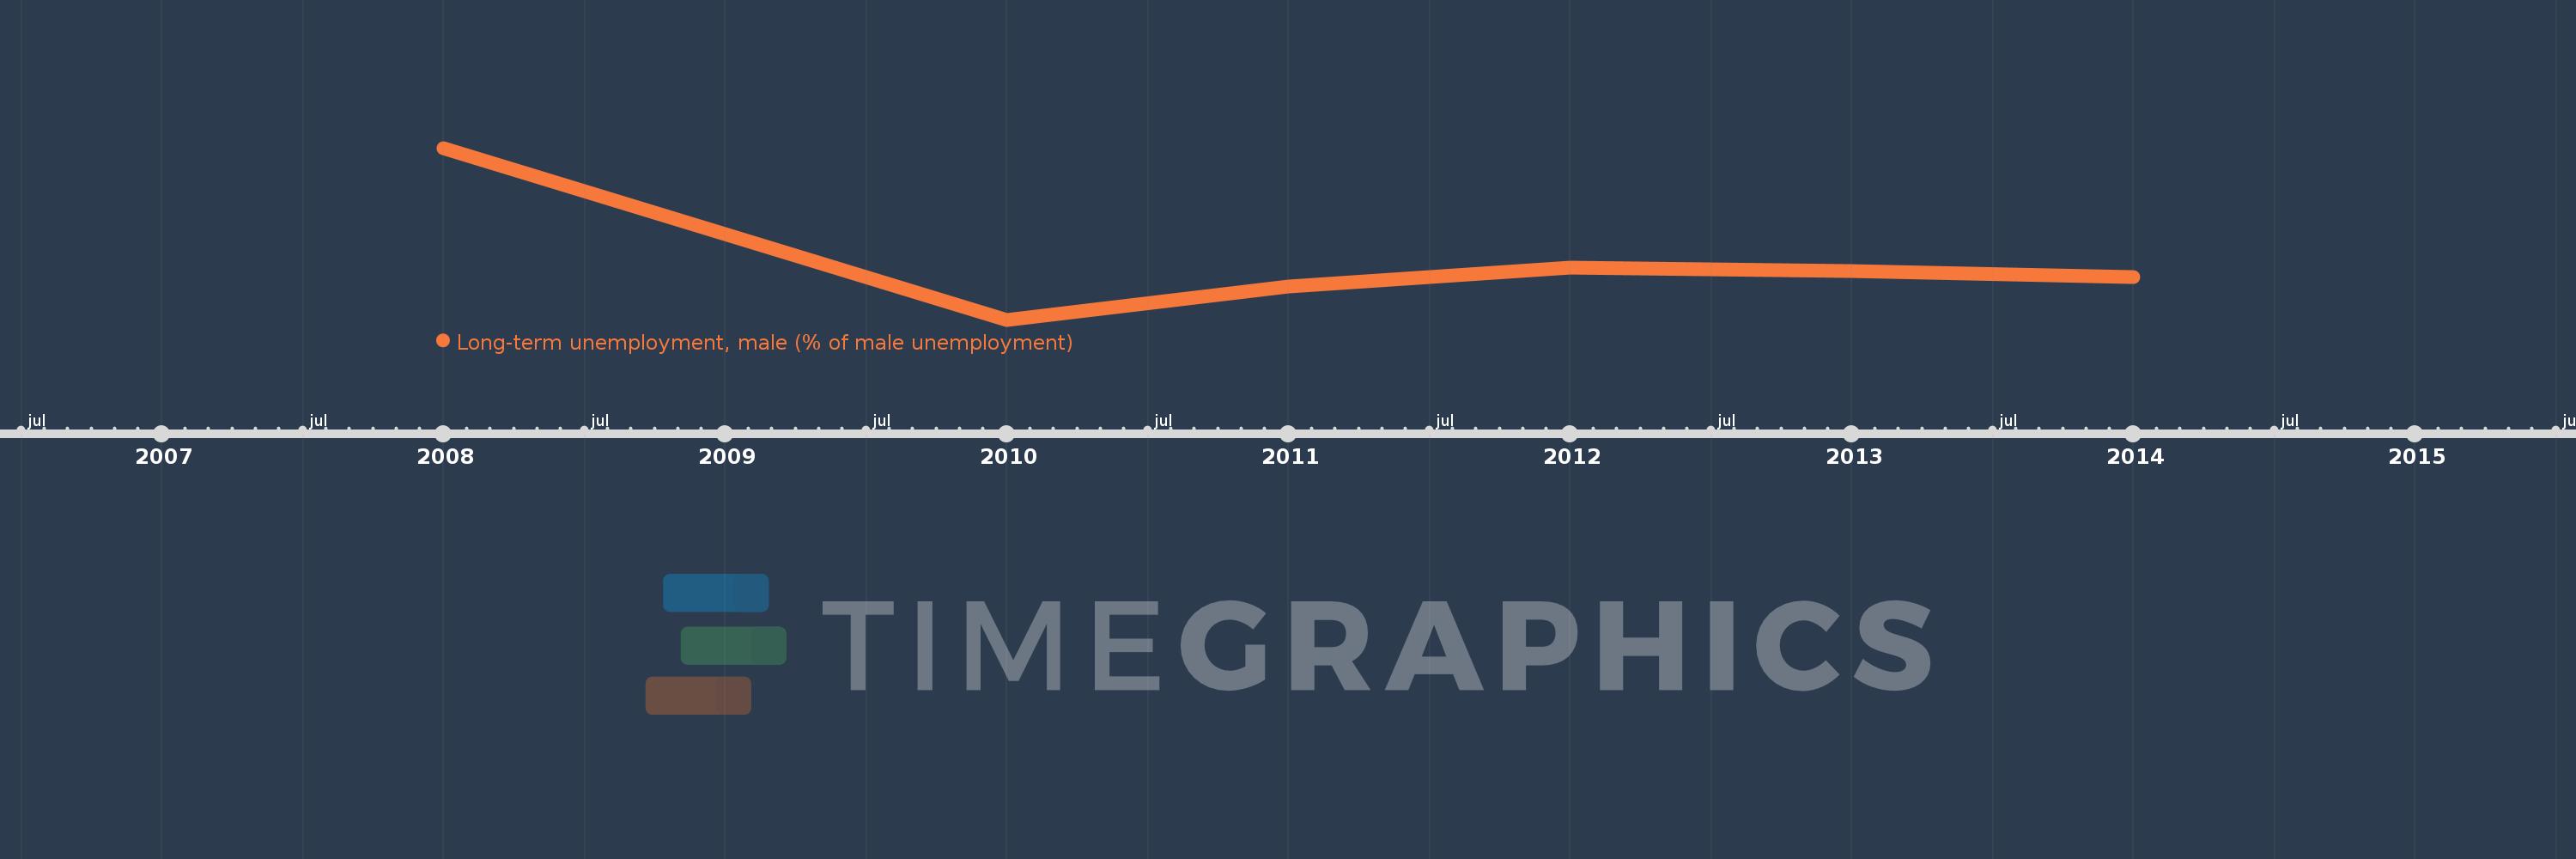
This timeline shows a graph from 2008 to 2014 of Europe & Central Asia (IDA & IBRD countries). No data until 2007. Number of actual observations by date: 6.
Source name:
World Development Indicators
Source organization:
International Labour Organization, Key Indicators of the Labour Market database.
Categories, topics:
Social Protection & Labor, Gender
Last updated:
apr 23, 2017
Indicators value changes by year
Meaning:
31.327
Minimum:
26.597
jan 1, 2010
Maximum:
40.591
jan 1, 2008
At the date of observation
Value
Absolute change
Change from the previous value
jan 1, 2008
40.591
+40.591
0.0%
jan 1, 2010
26.597
-13.993
-34.47%
jan 1, 2011
29.306
+2.709
10.18%
jan 1, 2012
30.812
+1.506
5.14%
jan 1, 2013
30.561
-0.252
-0.82%
jan 1, 2014
30.097
-0.464
-1.52%
Ranking of countries by current statistics by years