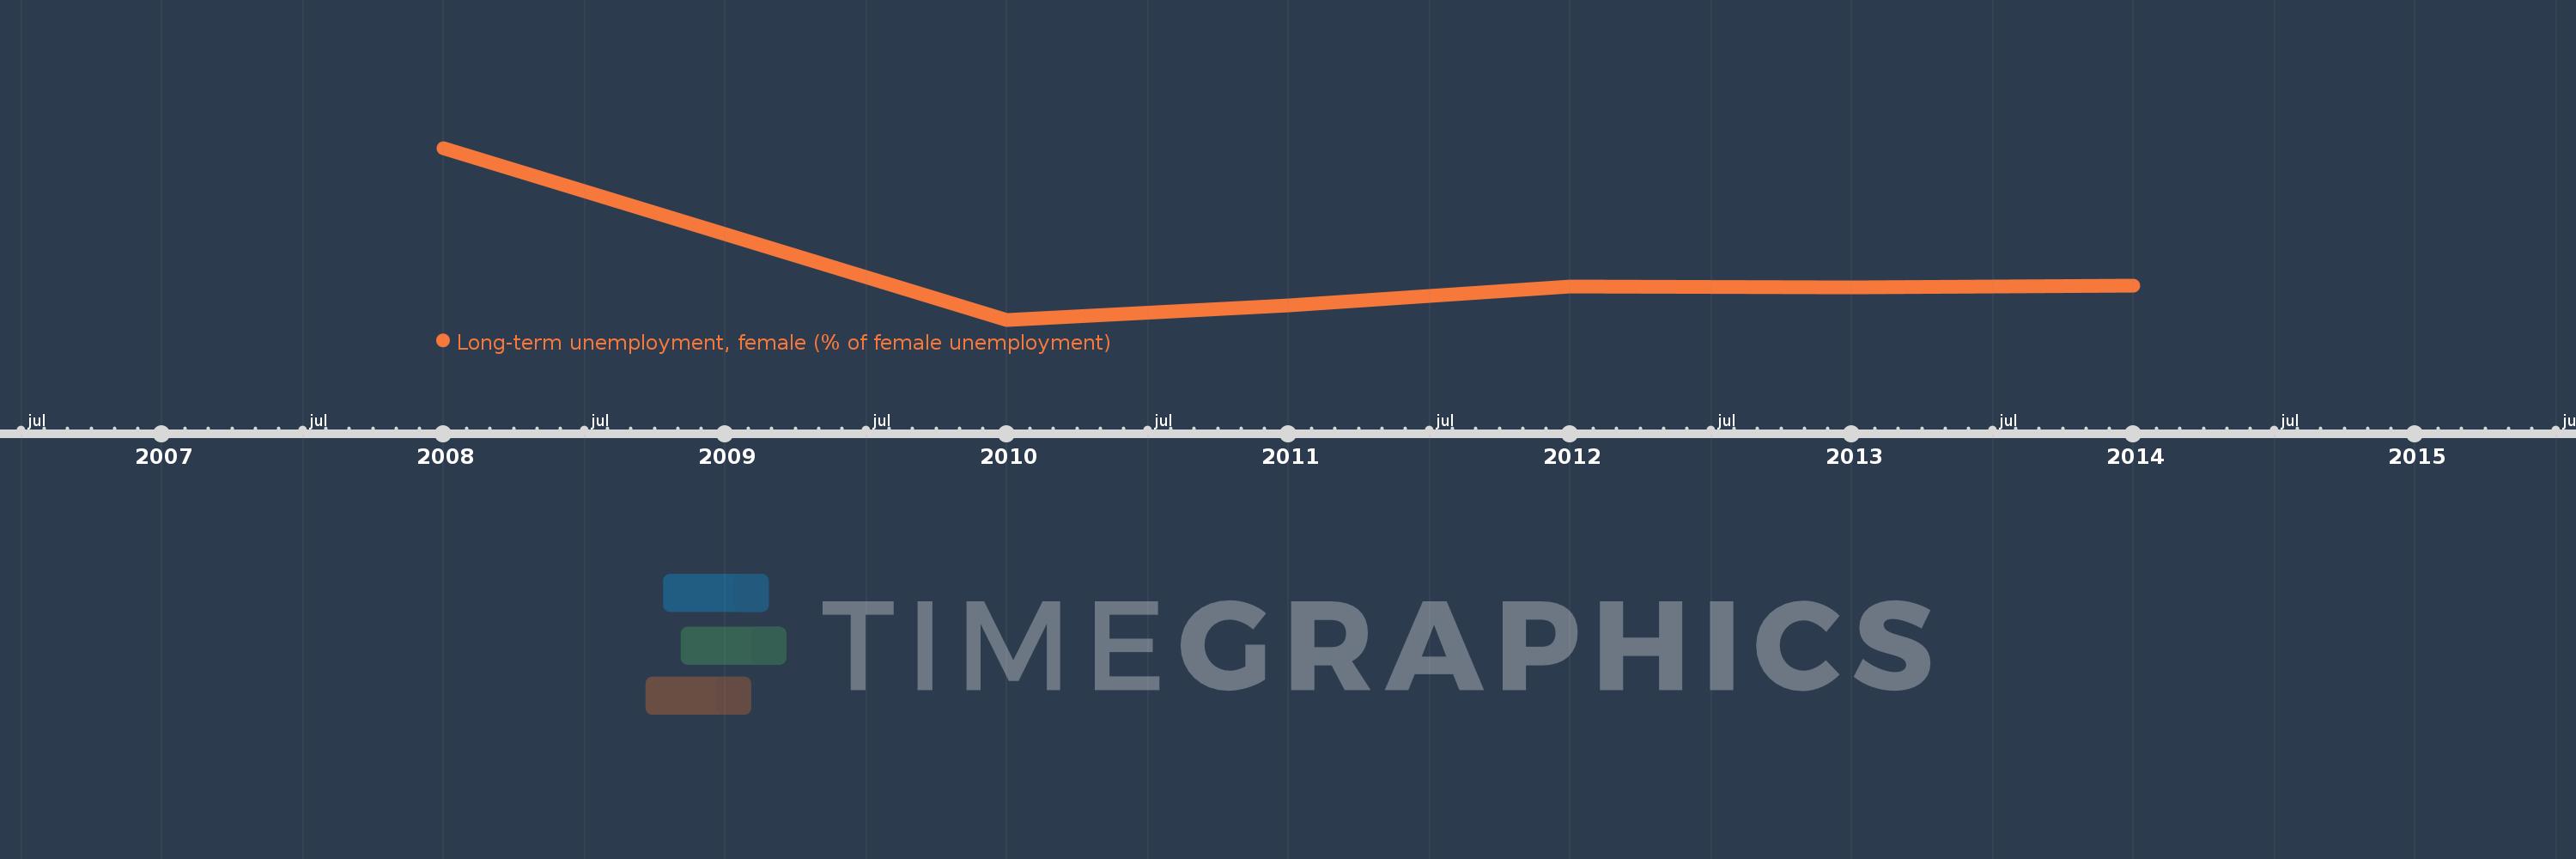
This timeline shows a graph from 2008 to 2014 of Europe & Central Asia (IDA & IBRD countries). No data until 2007. Number of actual observations by date: 6.
Source name:
World Development Indicators
Source organization:
International Labour Organization, Key Indicators of the Labour Market database.
Categories, topics:
Social Protection & Labor, Gender
Last updated:
apr 23, 2017
Indicators value changes by year
Meaning:
34.637
Minimum:
30.486
jan 1, 2010
Maximum:
45.457
jan 1, 2008
At the date of observation
Value
Absolute change
Change from the previous value
jan 1, 2008
45.457
+45.457
0.0%
jan 1, 2010
30.486
-14.971
-32.93%
jan 1, 2011
31.772
+1.286
4.22%
jan 1, 2012
33.371
+1.598
5.03%
jan 1, 2013
33.307
-0.064
-0.19%
jan 1, 2014
33.428
+0.121
0.36%
Ranking of countries by current statistics by years