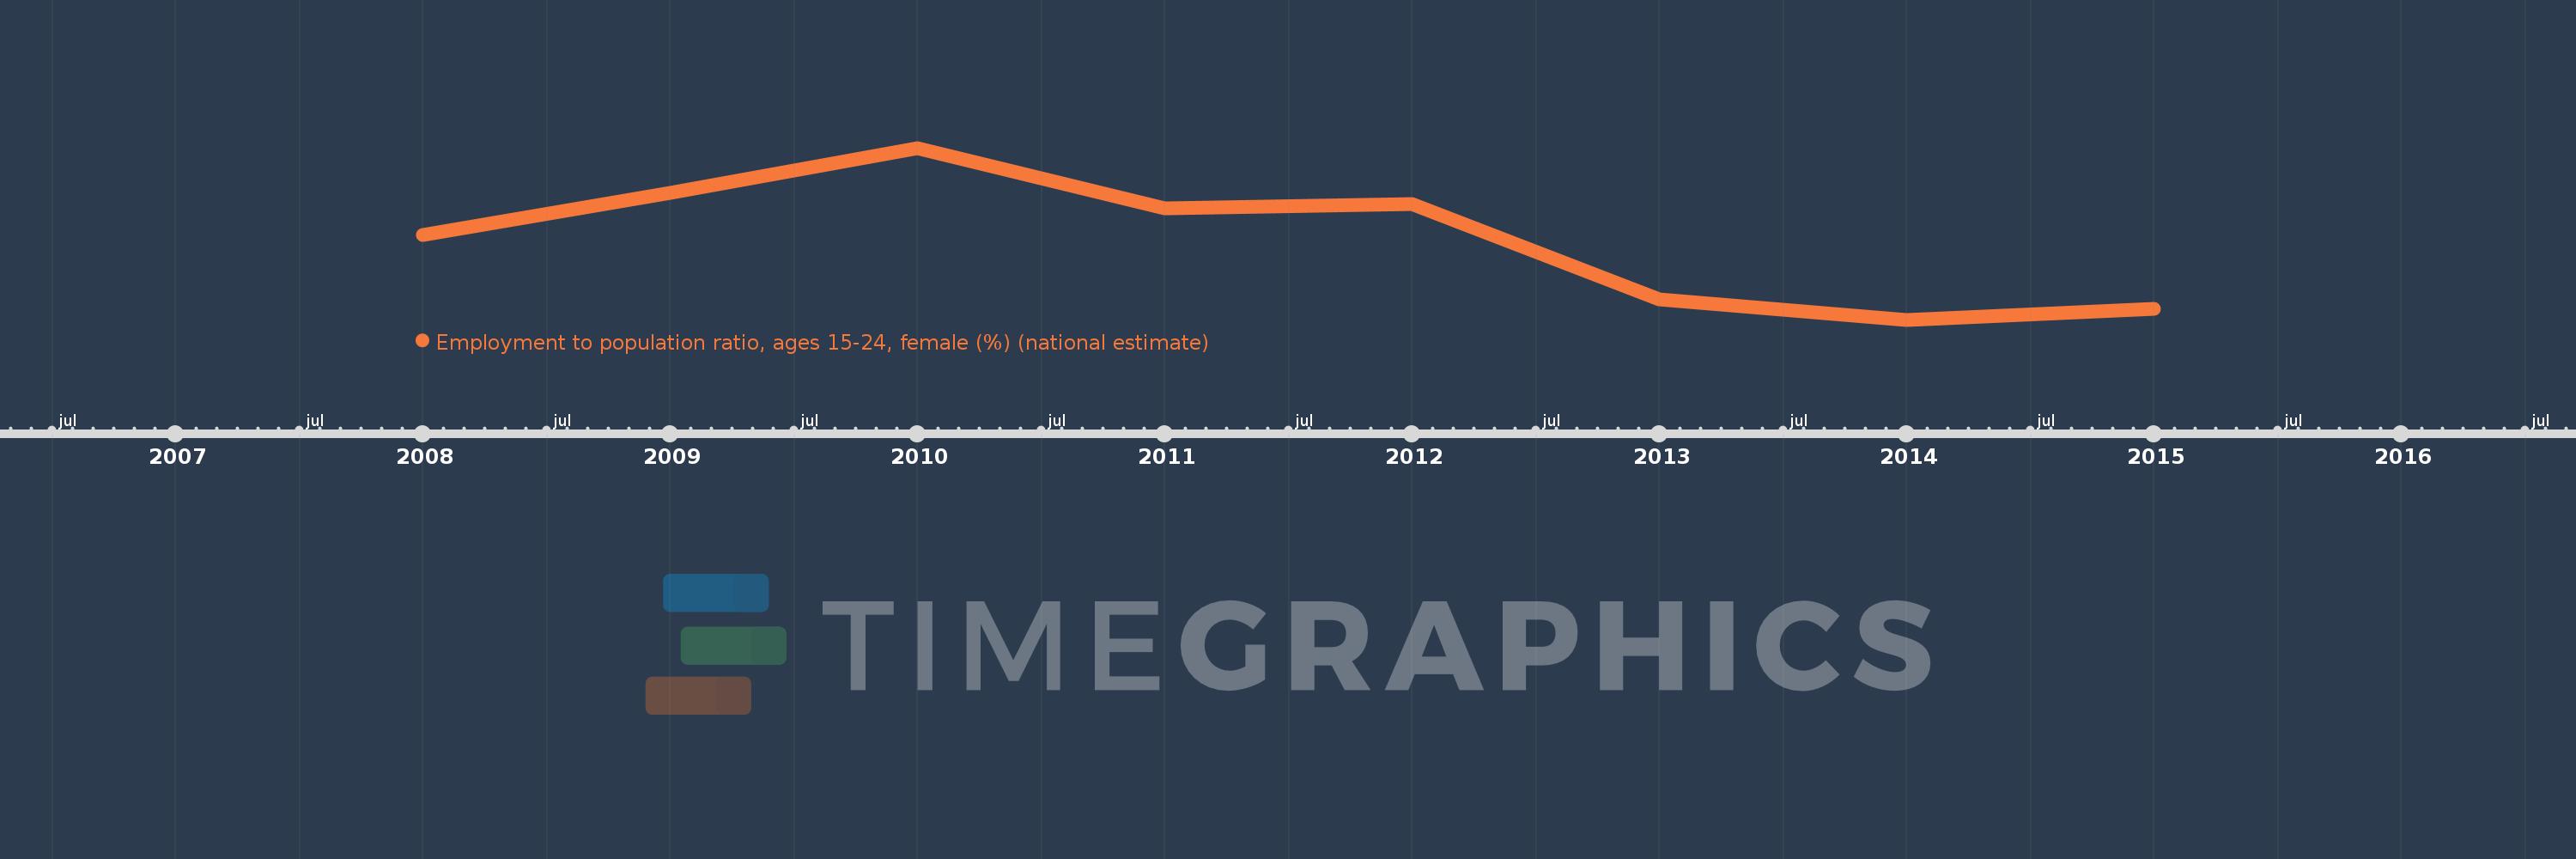
This timeline shows a graph from 2008 to 2015 of Europe & Central Asia (IDA & IBRD countries). No data until 2007. Number of actual observations by date: 8.
Source name:
World Development Indicators
Source organization:
International Labour Organization, Key Indicators of the Labour Market database.
Categories, topics:
Social Protection & Labor
Last updated:
apr 23, 2017
Indicators value changes by year
Meaning:
25.467
Minimum:
24.494
jan 1, 2014
Maximum:
26.577
jan 1, 2010
At the date of observation
Value
Absolute change
Change from the previous value
jan 1, 2008
25.517
+25.517
0.0%
jan 1, 2009
26.036
+0.518
2.03%
jan 1, 2010
26.577
+0.541
2.08%
jan 1, 2011
25.847
-0.73
-2.75%
jan 1, 2012
25.899
+0.052
0.2%
jan 1, 2013
24.741
-1.158
-4.47%
jan 1, 2014
24.494
-0.247
-1.0%
jan 1, 2015
24.625
+0.131
0.53%
Ranking of countries by current statistics by years