33
/
AIzaSyB4mHJ5NPEv-XzF7P6NDYXjlkCWaeKw5bc
November 30, 2025
32502
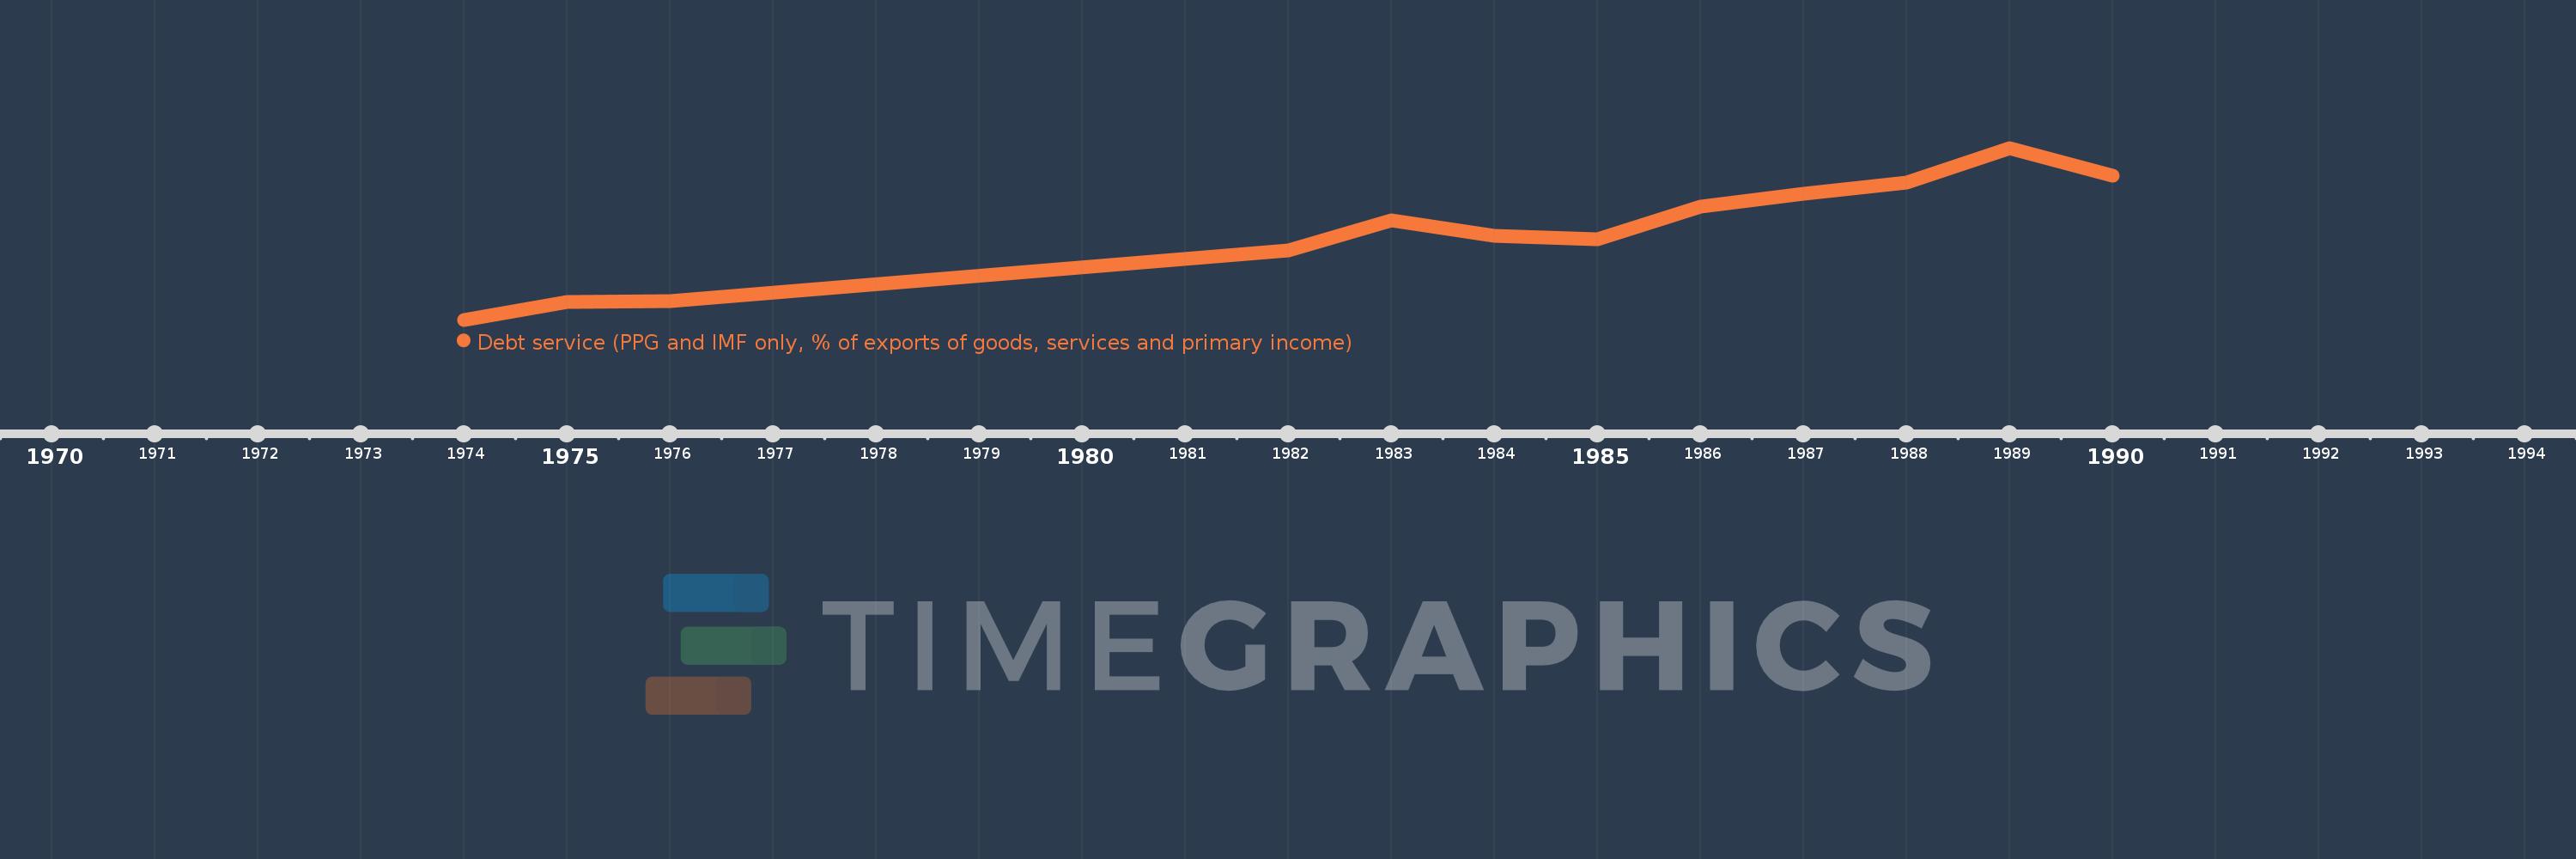
Europe & Central Asia (IDA & IBRD countries)
TEC
false
2
1
Debt service (PPG and IMF only, % of exports of goods, services and primary income)
1990,1989,1988,1987,1986,1985,1984,1983,1982,1976,1975,1974