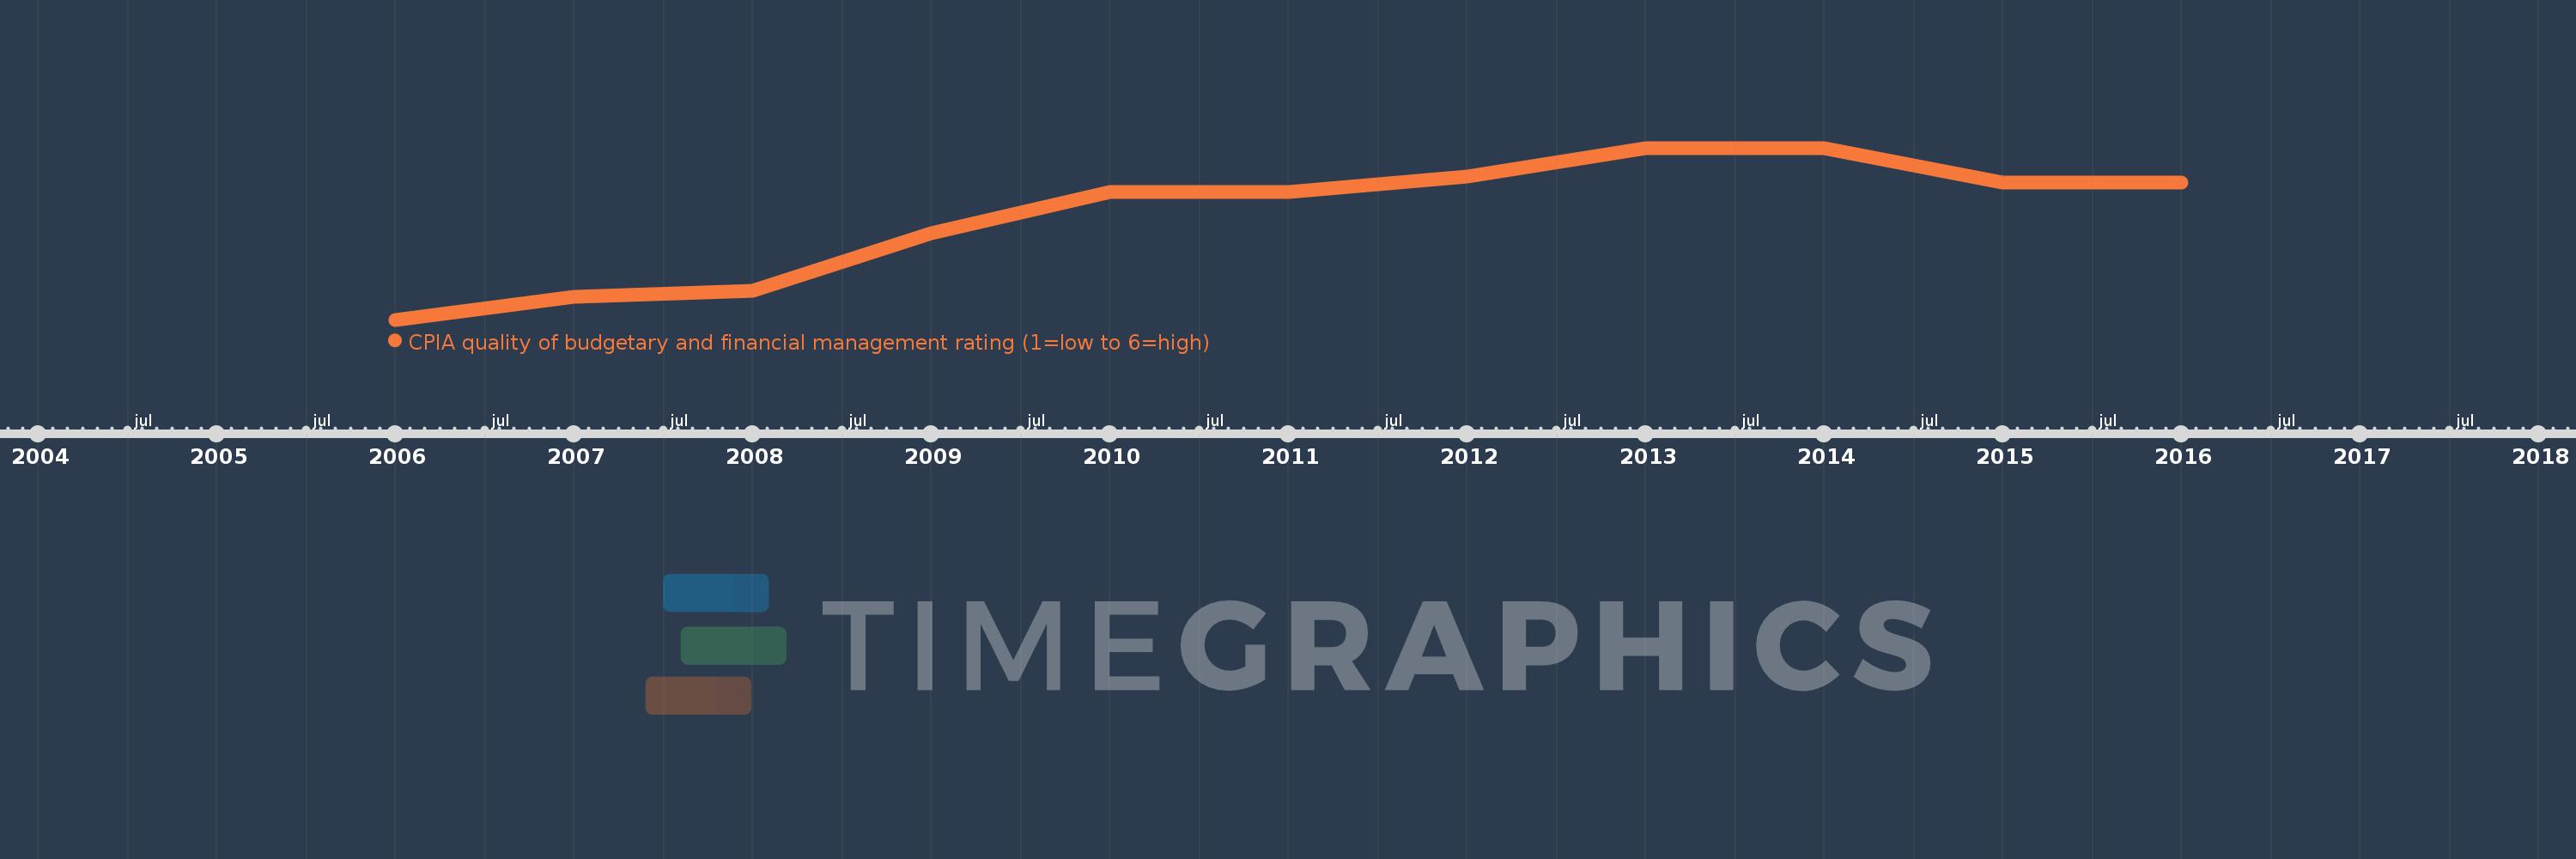
This timeline shows a graph from 2006 to 2016 of Europe & Central Asia (IDA & IBRD countries). No data until 2005. Number of actual observations by date: 11.
Source name:
World Development Indicators
Source organization:
World Bank Group, CPIA database (http://www.worldbank.org/ida).
Categories, topics:
Public Sector
Last updated:
apr 23, 2017
Indicators value changes by year
Meaning:
3.729
Minimum:
3.5
jan 1, 2006
Maximum:
3.875
jan 1, 2013
At the date of observation
Value
Absolute change
Change from the previous value
jan 1, 2006
3.5
+3.5
0.0%
jan 1, 2007
3.55
+0.05
1.43%
jan 1, 2008
3.563
+0.013
0.35%
jan 1, 2009
3.688
+0.125
3.51%
jan 1, 2010
3.778
+0.09
2.45%
jan 1, 2011
3.778
0.0
0.0%
jan 1, 2012
3.813
+0.035
0.92%
jan 1, 2013
3.875
+0.063
1.64%
jan 1, 2014
3.875
0.0
0.0%
jan 1, 2015
3.8
-0.075
-1.94%
jan 1, 2016
3.8
0.0
0.0%
Ranking of countries by current statistics by years