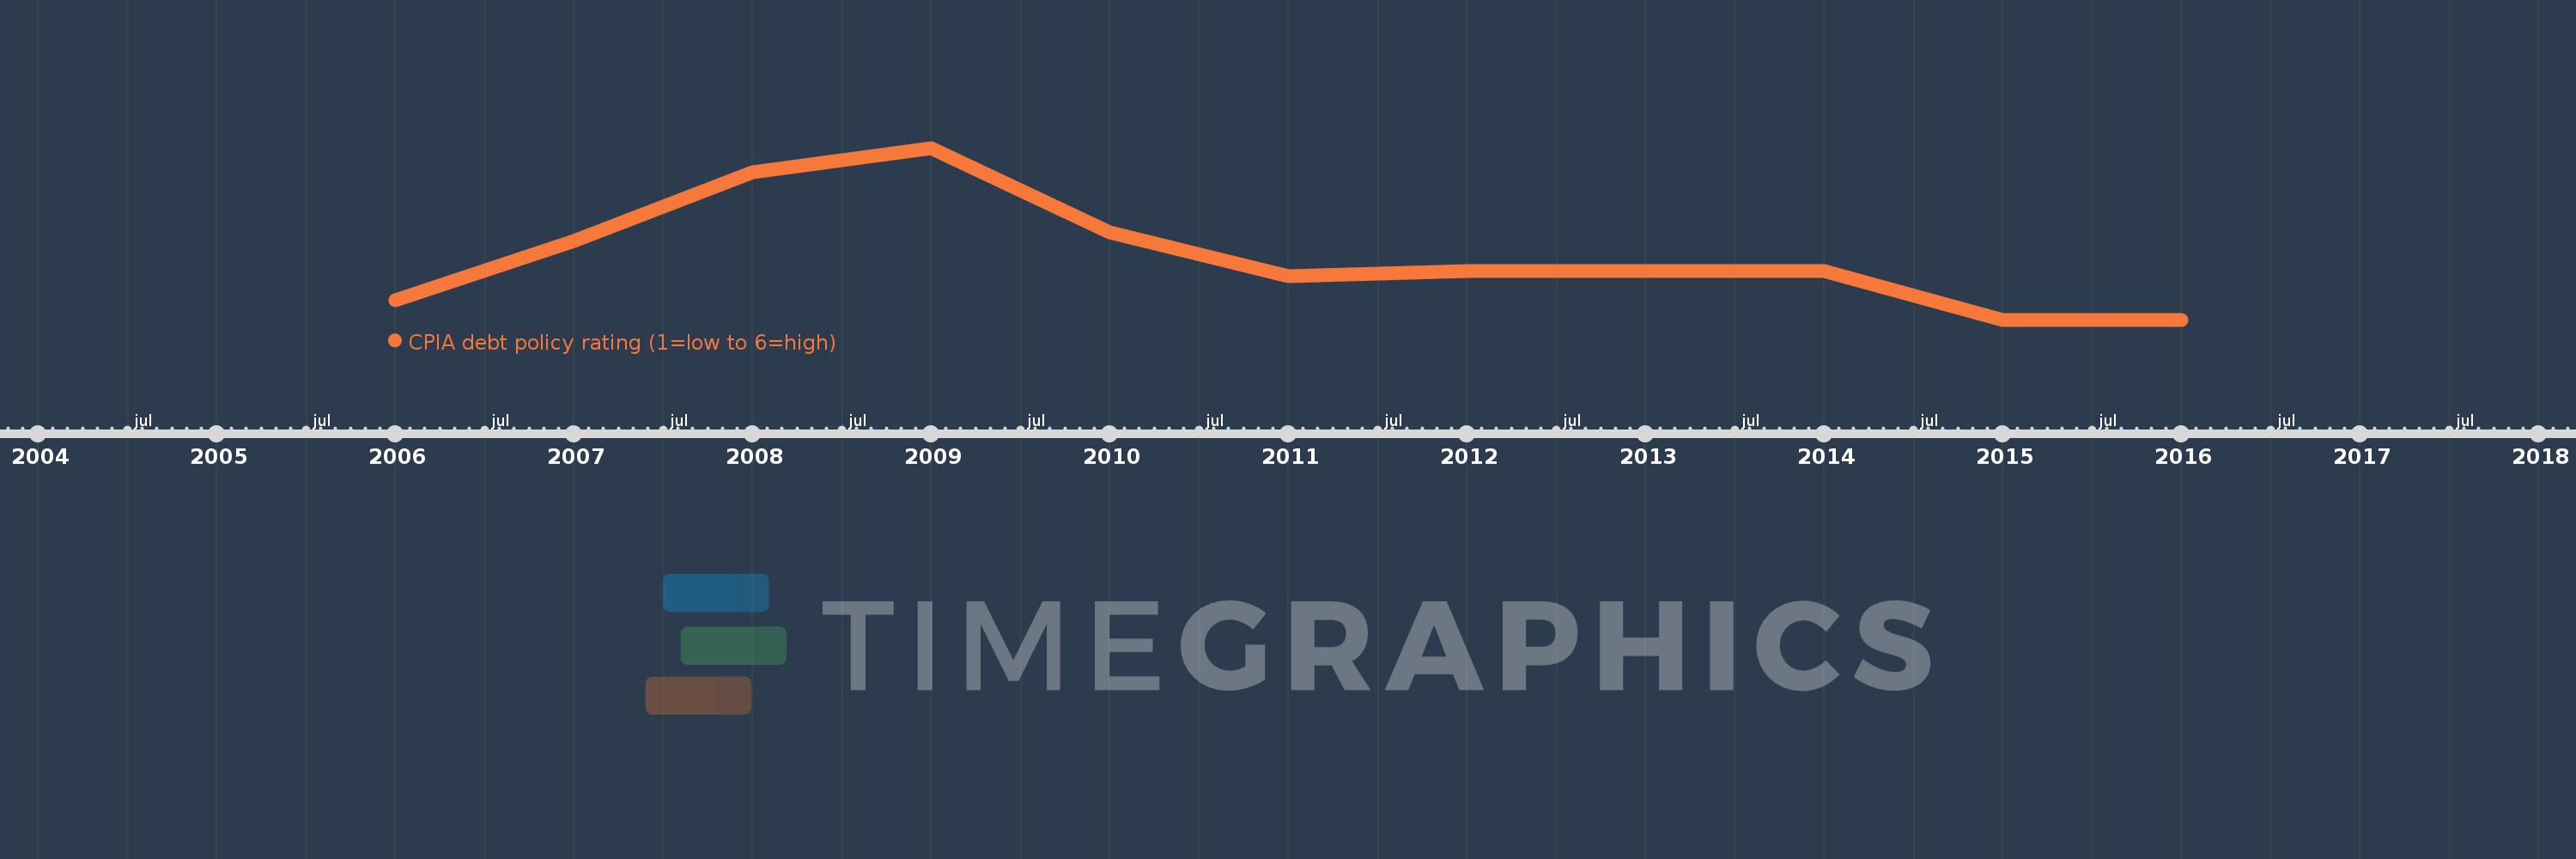
This timeline shows a graph from 2006 to 2016 of Europe & Central Asia (IDA & IBRD countries). No data until 2005. Number of actual observations by date: 11.
Source name:
World Development Indicators
Source organization:
World Bank Group, CPIA database (http://www.worldbank.org/ida).
Categories, topics:
Public Sector
Last updated:
apr 23, 2017
Indicators value changes by year
Meaning:
4.161
Minimum:
4.0
jan 1, 2015
Maximum:
4.438
jan 1, 2009
At the date of observation
Value
Absolute change
Change from the previous value
jan 1, 2006
4.05
+4.05
0.0%
jan 1, 2007
4.2
+0.15
3.7%
jan 1, 2008
4.375
+0.175
4.17%
jan 1, 2009
4.438
+0.063
1.43%
jan 1, 2010
4.222
-0.215
-4.85%
jan 1, 2011
4.111
-0.111
-2.63%
jan 1, 2012
4.125
+0.014
0.34%
jan 1, 2013
4.125
0.0
0.0%
jan 1, 2014
4.125
0.0
0.0%
jan 1, 2015
4.0
-0.125
-3.03%
jan 1, 2016
4.0
0.0
0.0%
Ranking of countries by current statistics by years