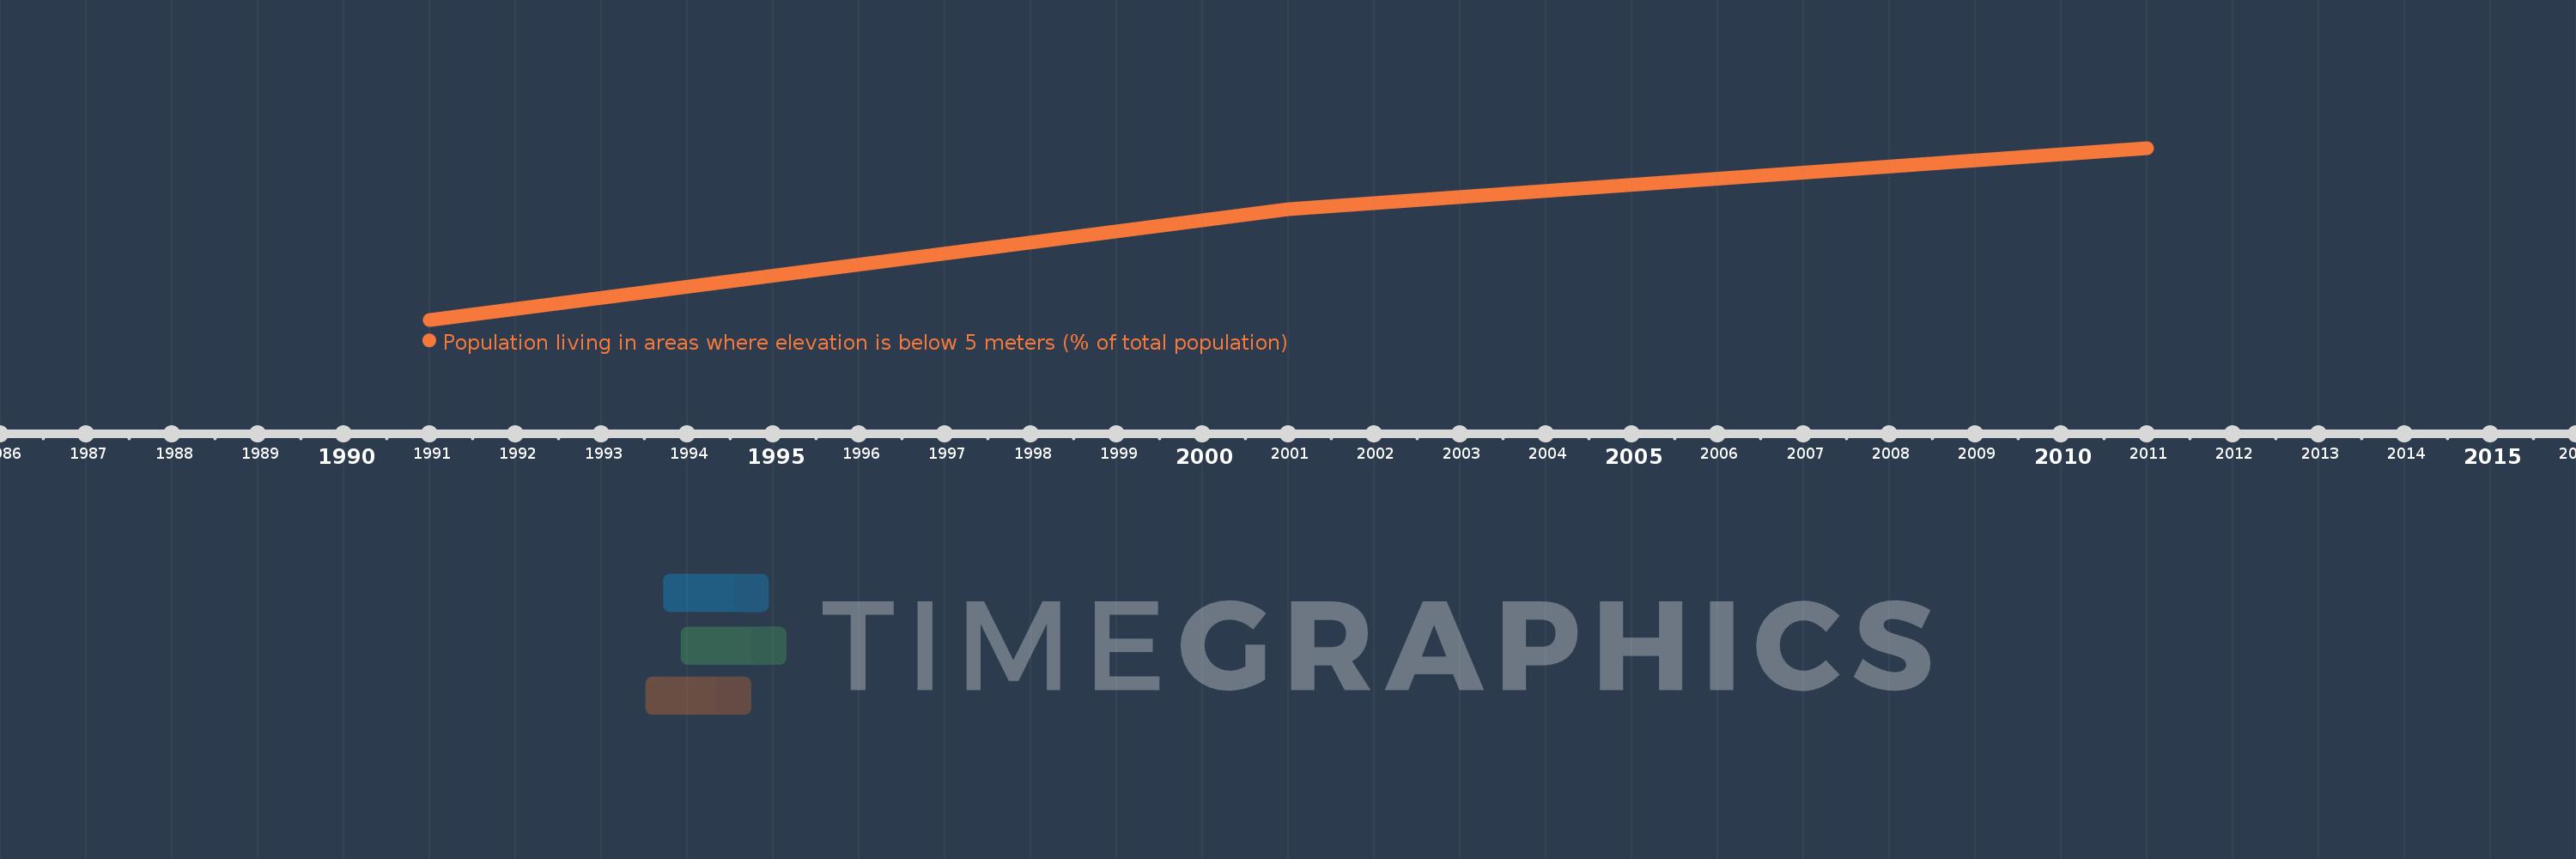
This timeline shows a graph from 1991 to 2011 of Europe & Central Asia (excluding high income). No data until 1990. Number of actual observations by date: 3.
Source name:
World Development Indicators
Source organization:
Center for International Earth Science Information Network (CIESIN)/Columbia University. 2013. Urban-Rural Population and Land Area Estimates Version 2. Palisades, NY: NASA Socioeconomic Data and Applications Center (SEDAC). http://sedac.ciesin.columbia.edu/data/set/lecz-urban-rural-population-land-area-estimates-v2.
Categories, topics:
Climate Change, Environment
Last updated:
apr 23, 2017
Indicators value changes by year
Meaning:
1.459
Minimum:
1.451
jan 1, 1991
Maximum:
1.465
jan 1, 2011
At the date of observation
Value
Absolute change
Change from the previous value
jan 1, 1991
1.451
+1.451
0.0%
jan 1, 2001
1.46
+0.009
0.65%
jan 1, 2011
1.465
+0.005
0.35%
Ranking of countries by current statistics by years