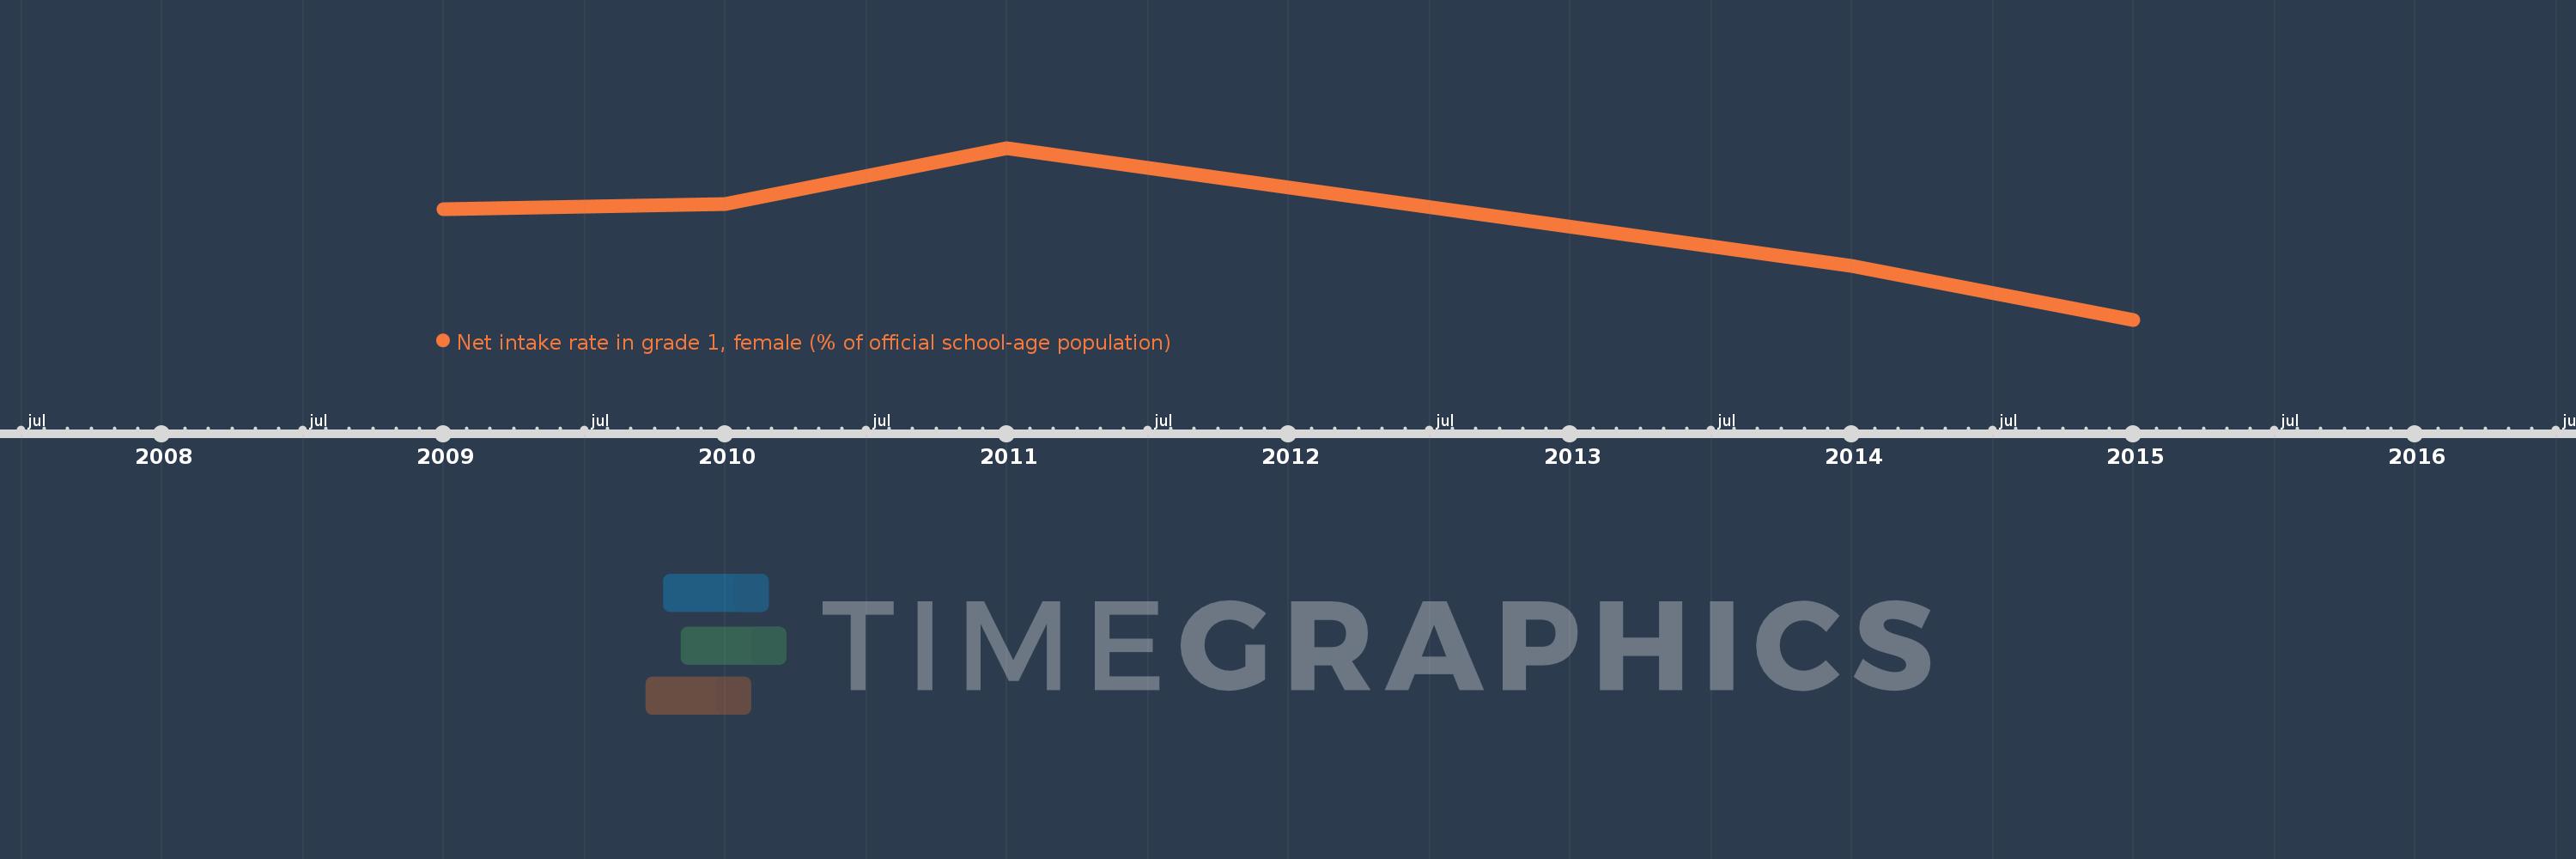
This timeline shows a graph from 2009 to 2015 of Europe & Central Asia (excluding high income). No data until 2008. Number of actual observations by date: 5.
Source name:
World Development Indicators
Source organization:
United Nations Educational, Scientific, and Cultural Organization (UNESCO) Institute for Statistics.
Categories, topics:
Education, Gender
Last updated:
apr 23, 2017
Indicators value changes by year
Meaning:
73.852
Minimum:
72.73
jan 1, 2015
Maximum:
74.861
jan 1, 2011
At the date of observation
Value
Absolute change
Change from the previous value
jan 1, 2009
74.104
+74.104
0.0%
jan 1, 2010
74.17
+0.065
0.09%
jan 1, 2011
74.861
+0.692
0.93%
jan 1, 2014
73.395
-1.467
-1.96%
jan 1, 2015
72.73
-0.665
-0.91%
Ranking of countries by current statistics by years