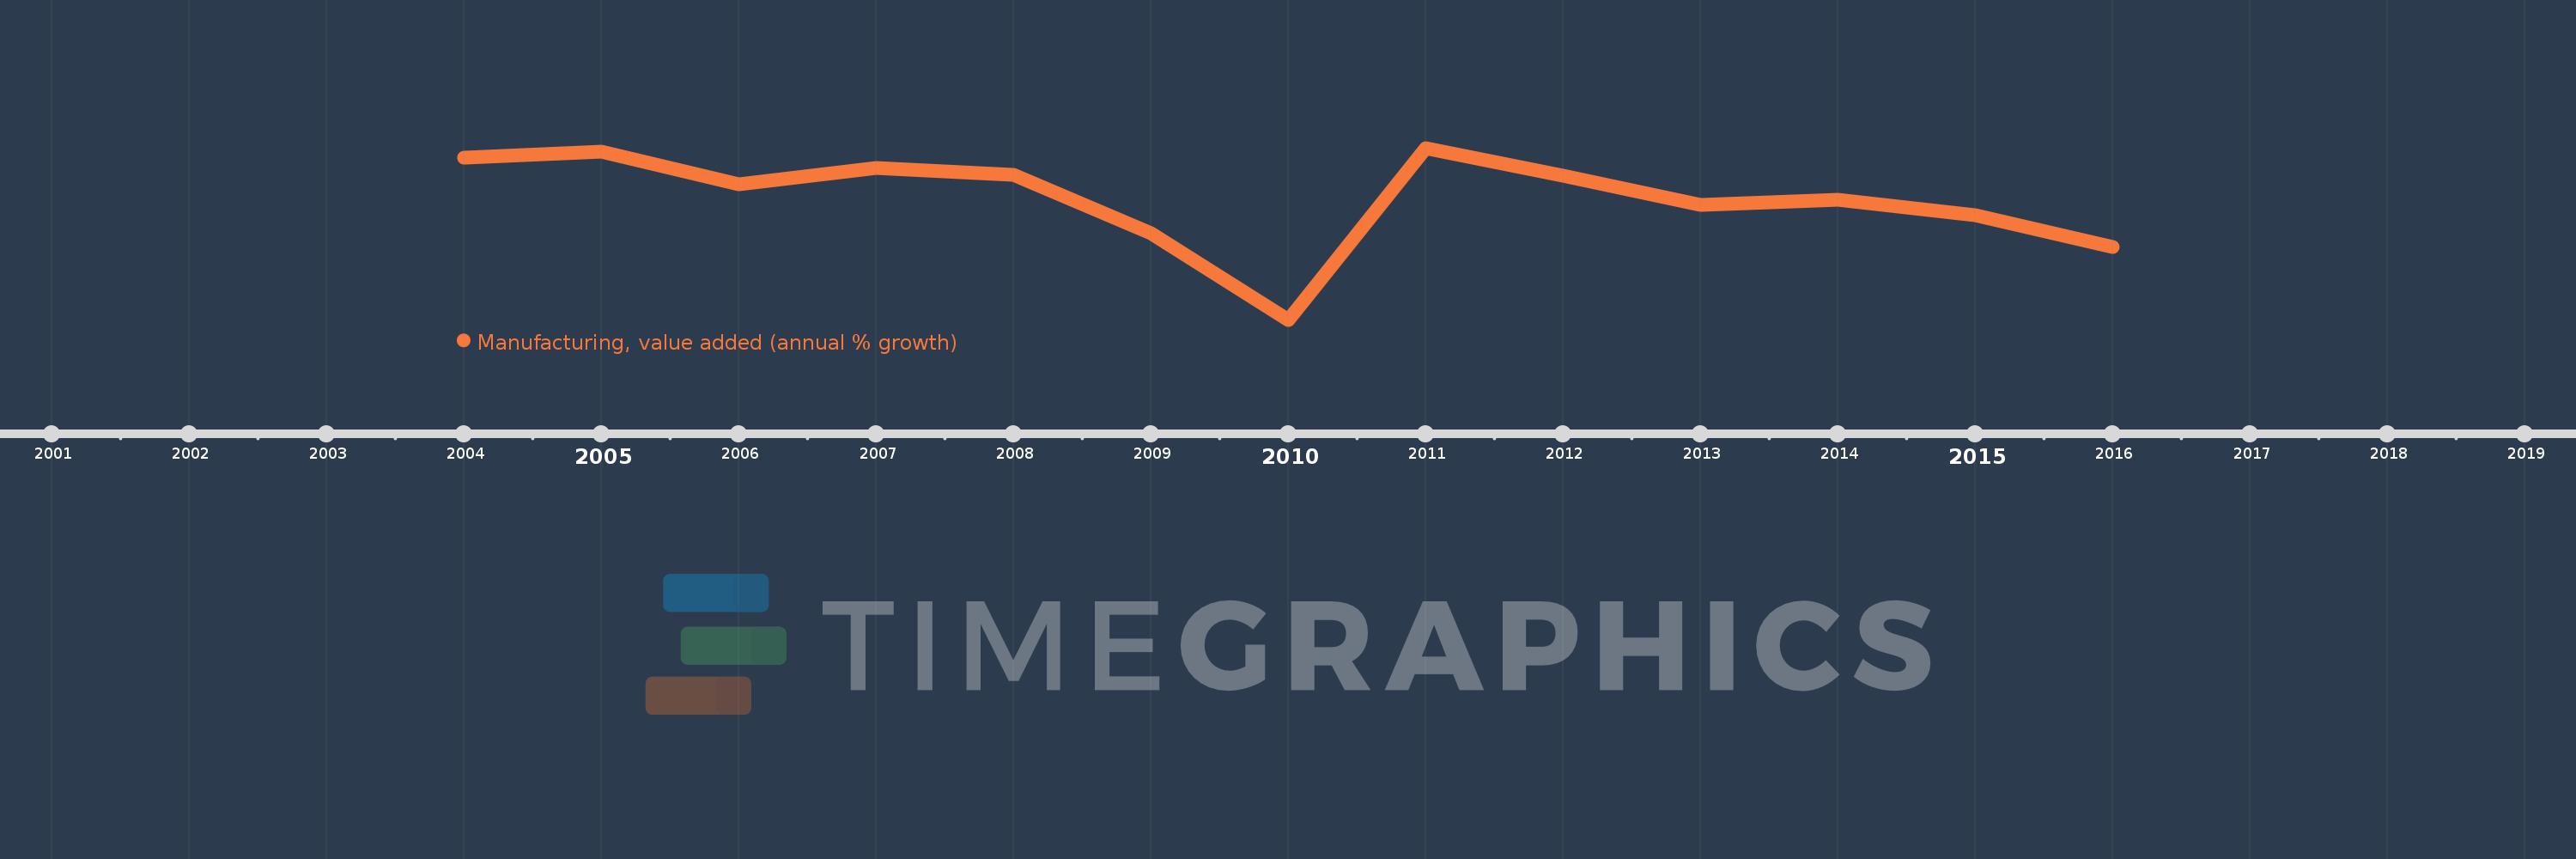
This timeline shows a graph from 2004 to 2016 of Europe & Central Asia (excluding high income). No data until 2003. Number of actual observations by date: 13.
Source name:
World Development Indicators
Source organization:
World Bank national accounts data, and OECD National Accounts data files.
Categories, topics:
Economy & Growth
Last updated:
apr 23, 2017
Indicators value changes by year
Meaning:
3.825
Minimum:
-10.845
jan 1, 2010
Maximum:
9.936
jan 1, 2011
At the date of observation
Value
Absolute change
Change from the previous value
jan 1, 2004
8.716
+8.716
0.0%
jan 1, 2005
9.509
+0.793
9.1%
jan 1, 2006
5.534
-3.975
-41.8%
jan 1, 2007
7.524
+1.989
35.95%
jan 1, 2008
6.667
-0.856
-11.38%
jan 1, 2009
-0.332
-6.999
-104.98%
jan 1, 2010
-10.845
-10.514
3.17K%
jan 1, 2011
9.936
+20.781
-191.61%
jan 1, 2012
6.531
-3.405
-34.27%
jan 1, 2013
3.07
-3.461
-53.0%
jan 1, 2014
3.683
+0.614
19.99%
jan 1, 2015
1.772
-1.911
-51.89%
jan 1, 2016
-2.04
-3.812
-215.1%
Ranking of countries by current statistics by years