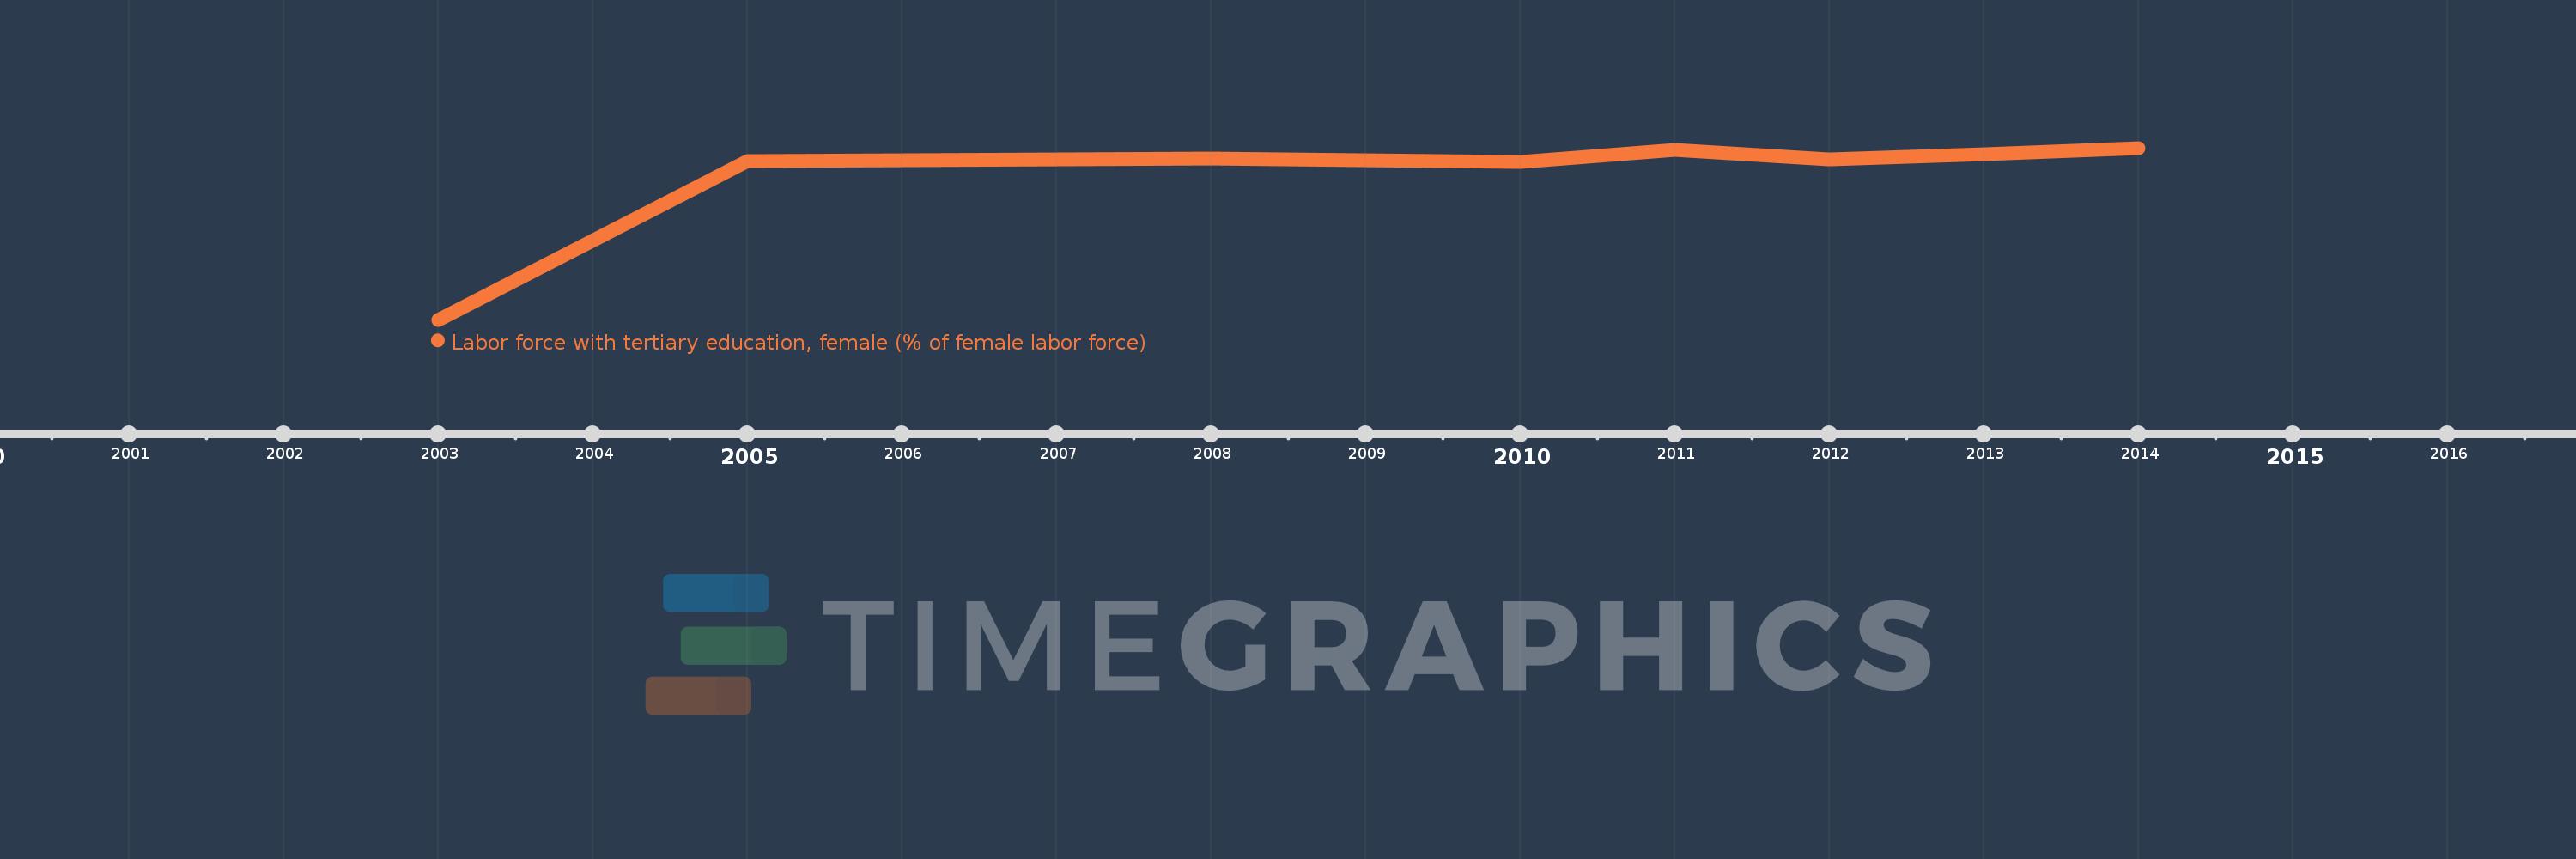
This timeline shows a graph from 2003 to 2014 of Europe & Central Asia (excluding high income). No data until 2002. Number of actual observations by date: 8.
Source name:
World Development Indicators
Source organization:
International Labour Organization, Key Indicators of the Labour Market database.
Categories, topics:
Education, Social Protection & Labor, Gender
Last updated:
apr 23, 2017
Indicators value changes by year
Meaning:
45.208
Minimum:
25.958
jan 1, 2003
Maximum:
49.051
jan 1, 2014
At the date of observation
Value
Absolute change
Change from the previous value
jan 1, 2003
25.958
+25.958
0.0%
jan 1, 2005
47.331
+21.373
82.34%
jan 1, 2008
47.641
+0.311
0.66%
jan 1, 2010
47.157
-0.485
-1.02%
jan 1, 2011
48.794
+1.638
3.47%
jan 1, 2012
47.501
-1.293
-2.65%
jan 1, 2013
48.23
+0.729
1.53%
jan 1, 2014
49.051
+0.822
1.7%
Ranking of countries by current statistics by years