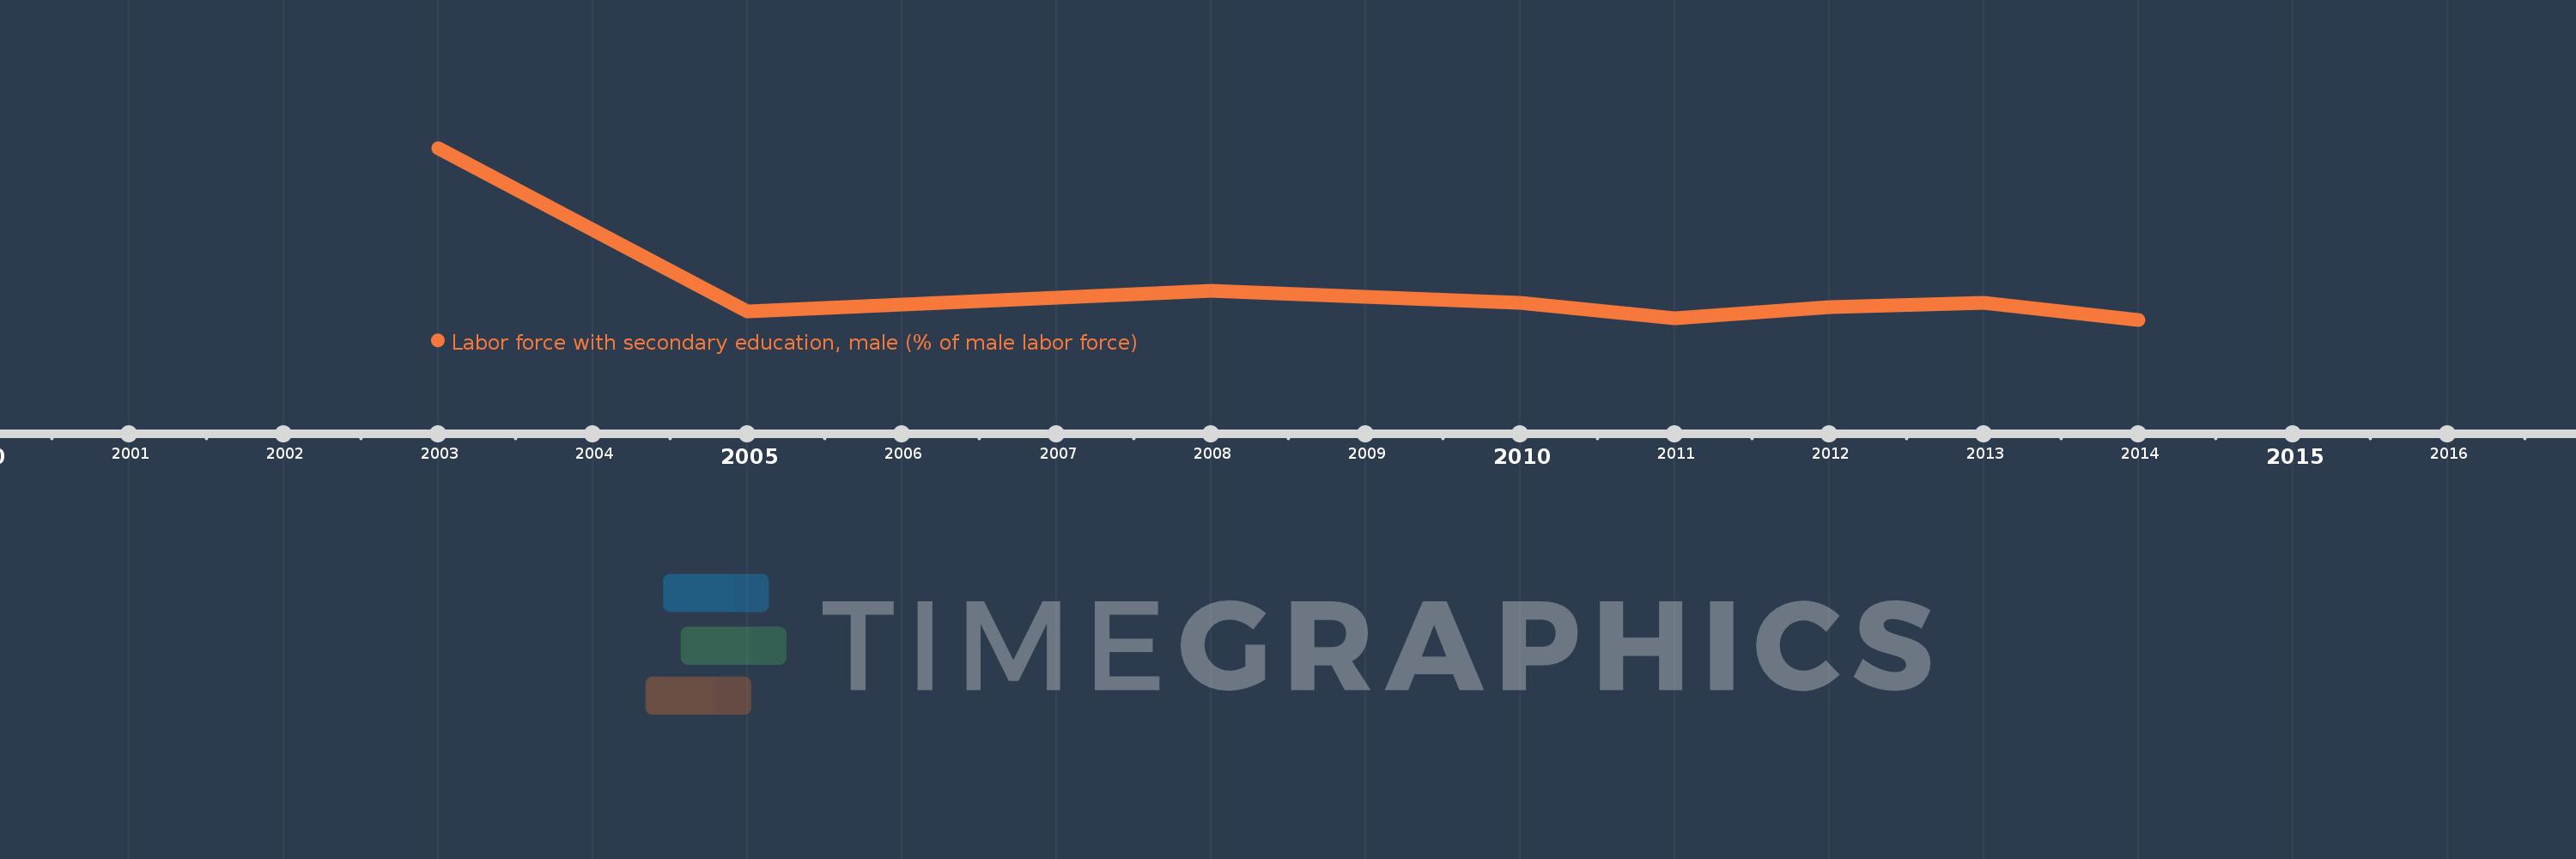
This timeline shows a graph from 2003 to 2014 of Europe & Central Asia (excluding high income). No data until 2002. Number of actual observations by date: 8.
Source name:
World Development Indicators
Source organization:
International Labour Organization, Key Indicators of the Labour Market database.
Categories, topics:
Education, Social Protection & Labor, Gender
Last updated:
apr 23, 2017
Indicators value changes by year
Meaning:
45.327
Minimum:
43.244
jan 1, 2014
Maximum:
54.415
jan 1, 2003
At the date of observation
Value
Absolute change
Change from the previous value
jan 1, 2003
54.415
+54.415
0.0%
jan 1, 2005
43.797
-10.617
-19.51%
jan 1, 2008
45.118
+1.321
3.02%
jan 1, 2010
44.355
-0.764
-1.69%
jan 1, 2011
43.32
-1.034
-2.33%
jan 1, 2012
44.05
+0.729
1.68%
jan 1, 2013
44.318
+0.269
0.61%
jan 1, 2014
43.244
-1.075
-2.42%
Ranking of countries by current statistics by years