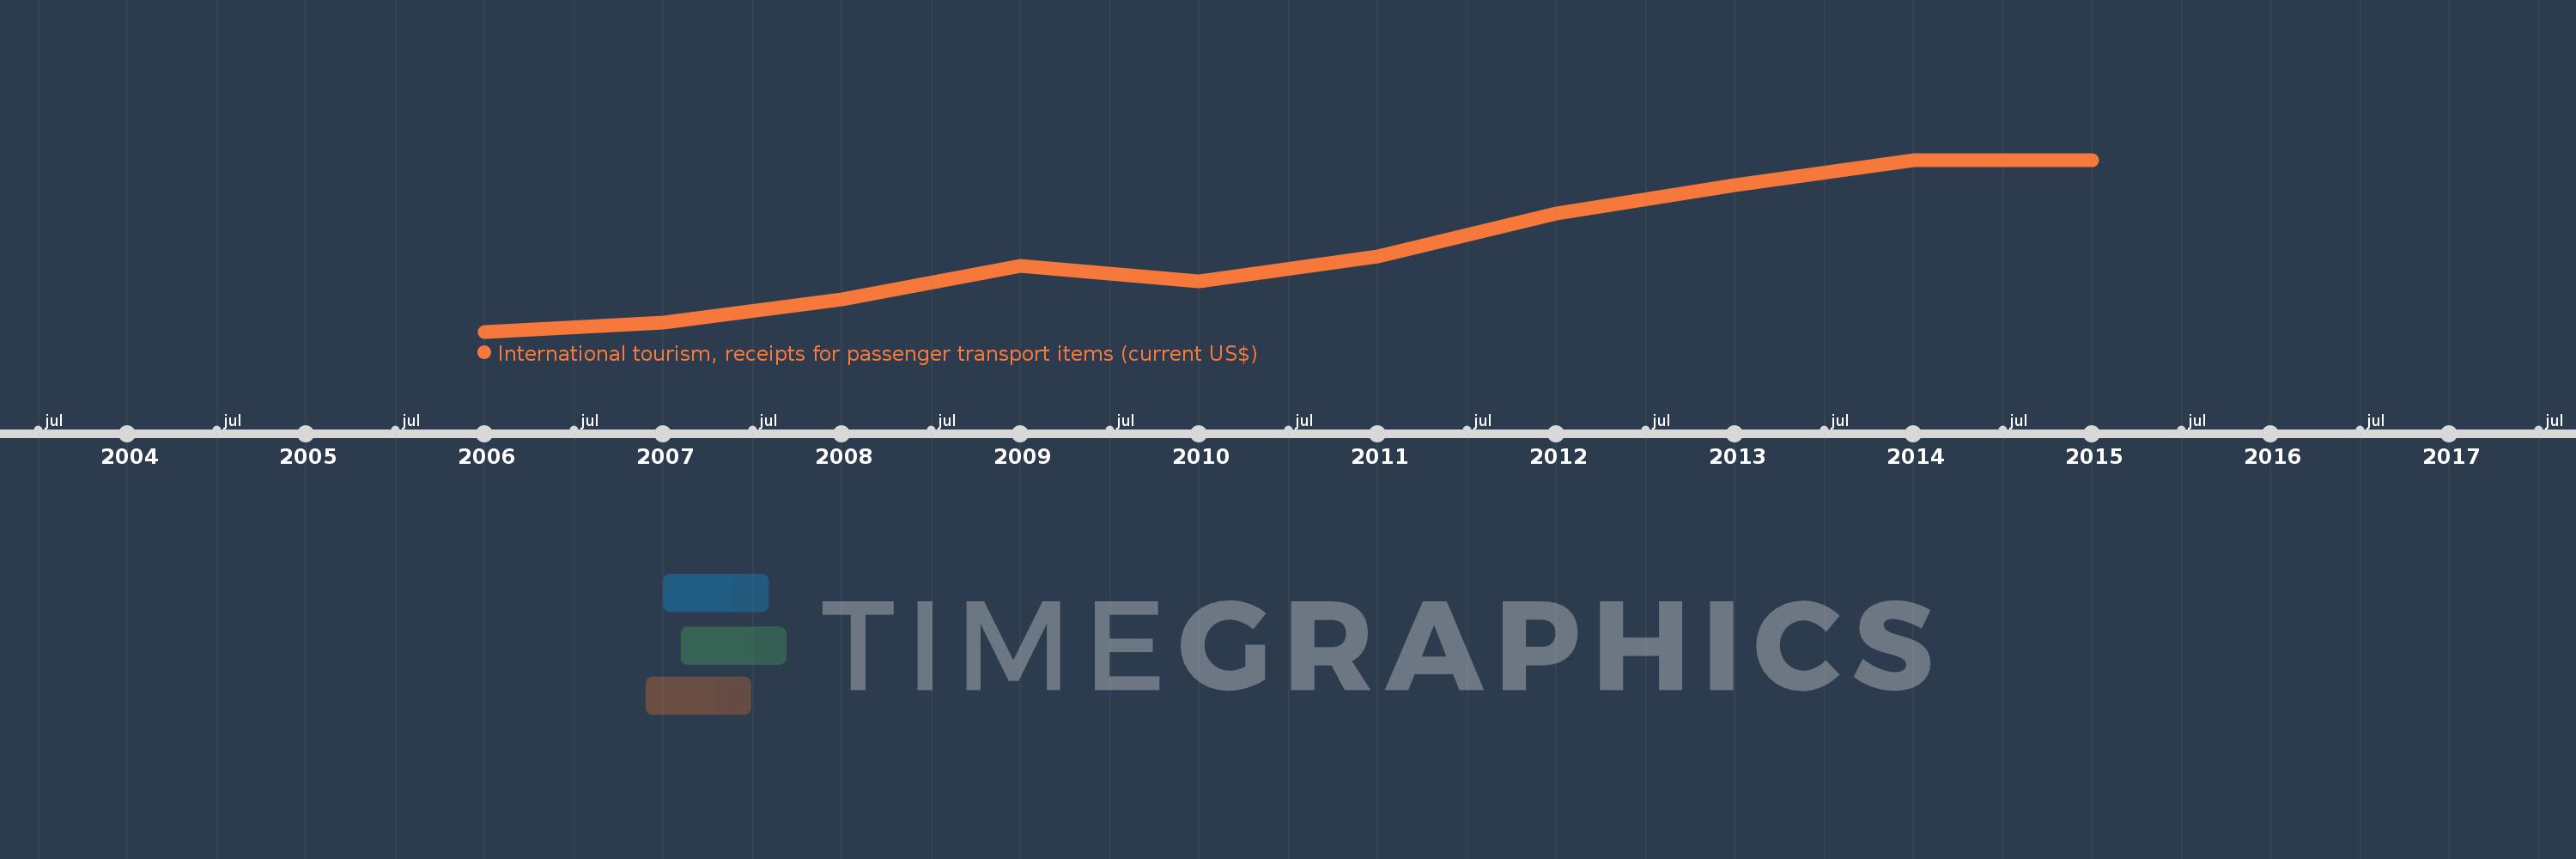
This timeline shows a graph from 2006 to 2015 of Europe & Central Asia (excluding high income). No data until 2005. Number of actual observations by date: 10.
Source name:
World Development Indicators
Source organization:
World Tourism Organization, Yearbook of Tourism Statistics, Compendium of Tourism Statistics and data files.
Categories, topics:
Private Sector, Trade
Last updated:
apr 23, 2017
Indicators value changes by year
Meaning:
12.329 bln
Minimum:
5.539 bln
jan 1, 2006
Maximum:
19.43 bln
jan 1, 2015
At the date of observation
Value
Absolute change
Change from the previous value
jan 1, 2006
5.539 bln
+5.539 bln
0.0%
jan 1, 2007
6.275 bln
+736.304 mln
13.29%
jan 1, 2008
8.164 bln
+1.889 bln
30.1%
jan 1, 2009
10.845 bln
+2.68 bln
32.83%
jan 1, 2010
9.573 bln
-1.272 bln
-11.73%
jan 1, 2011
11.592 bln
+2.019 bln
21.09%
jan 1, 2012
15.085 bln
+3.493 bln
30.13%
jan 1, 2013
17.408 bln
+2.323 bln
15.4%
jan 1, 2014
19.38 bln
+1.972 bln
11.33%
jan 1, 2015
19.43 bln
+50.22 mln
0.26%
Ranking of countries by current statistics by years