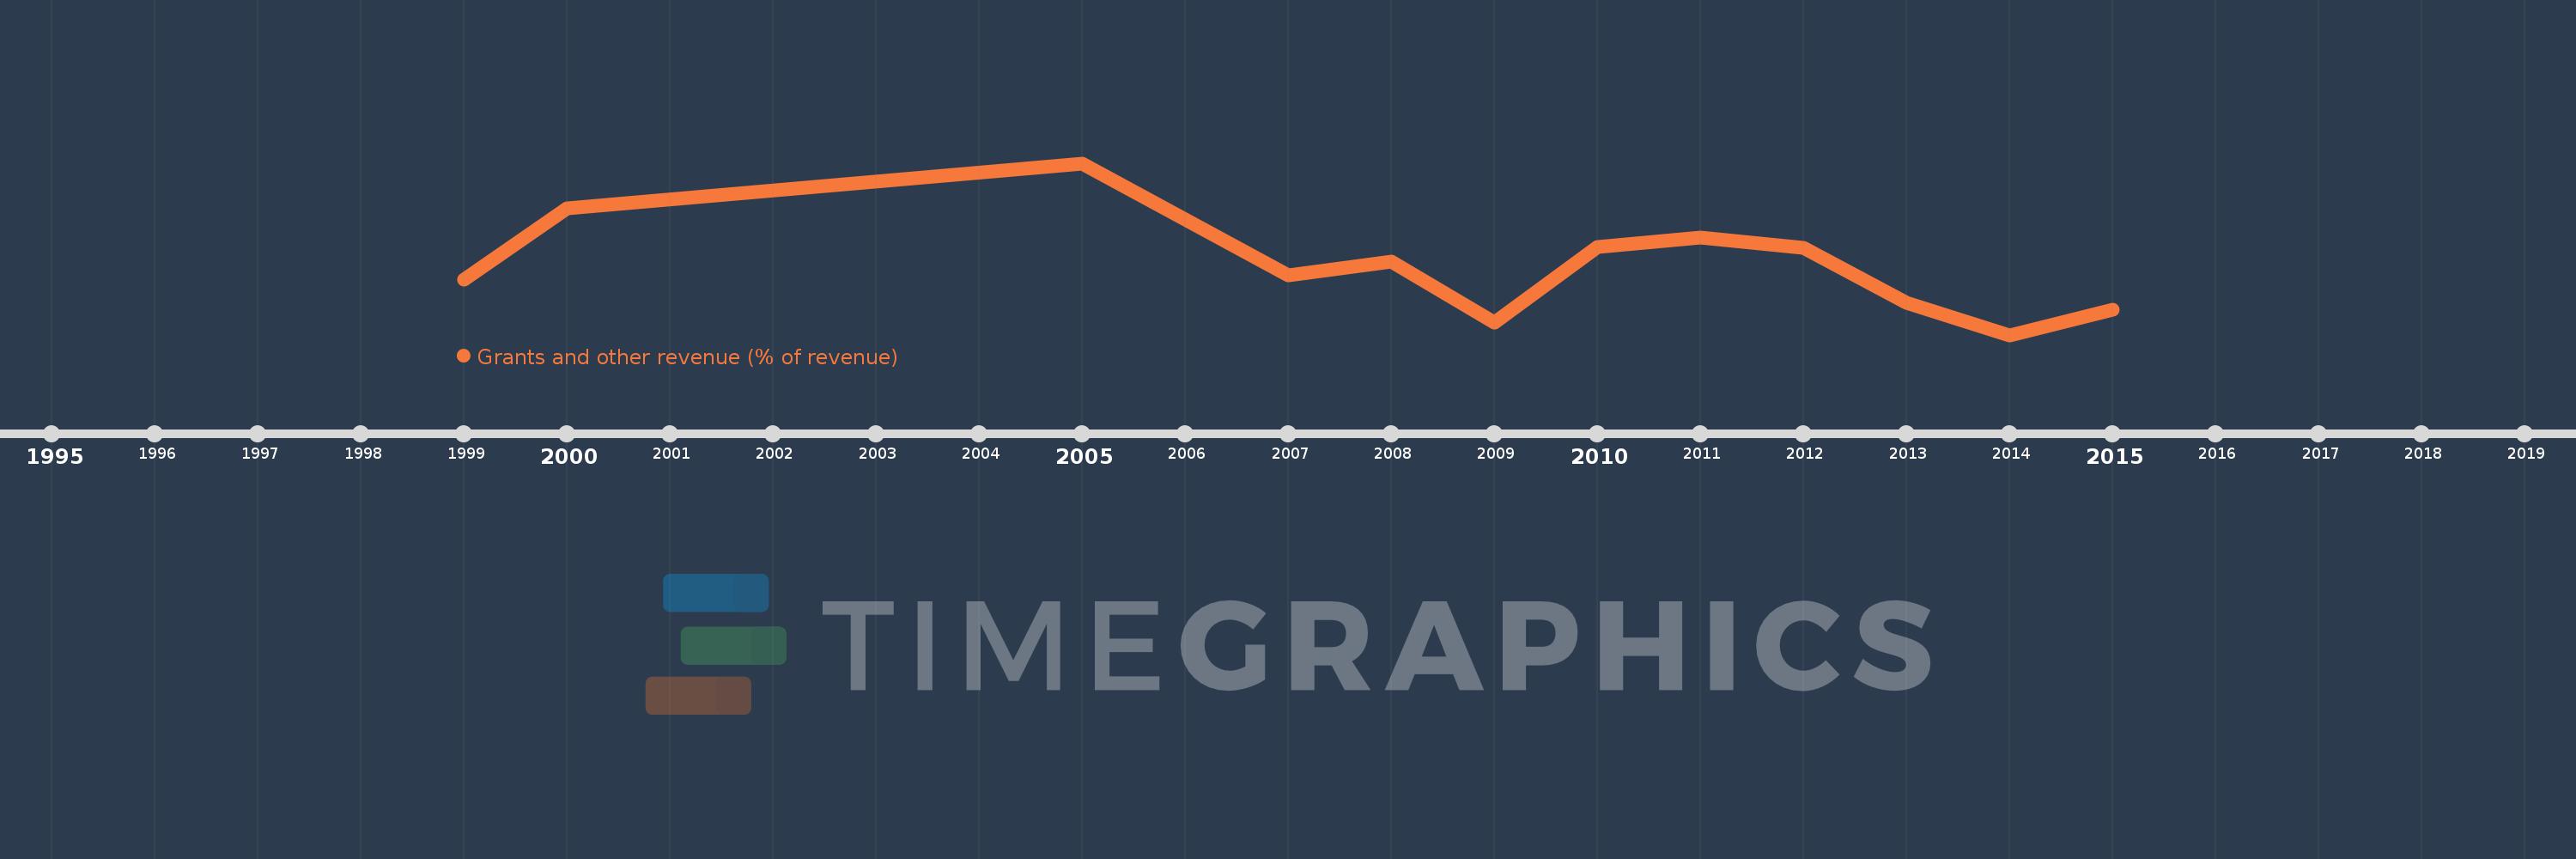
This timeline shows a graph from 1999 to 2015 of Europe & Central Asia (excluding high income). No data until 1998. Number of actual observations by date: 12.
Source name:
World Development Indicators
Source organization:
International Monetary Fund, Government Finance Statistics Yearbook and data files.
Categories, topics:
Public Sector
Last updated:
apr 23, 2017
Indicators value changes by year
Meaning:
15.048
Minimum:
13.895
jan 1, 2014
Maximum:
16.759
jan 1, 2005
At the date of observation
Value
Absolute change
Change from the previous value
jan 1, 1999
14.814
+14.814
0.0%
jan 1, 2000
16.012
+1.198
8.08%
jan 1, 2005
16.759
+0.747
4.67%
jan 1, 2007
14.89
-1.869
-11.15%
jan 1, 2008
15.12
+0.23
1.55%
jan 1, 2009
14.103
-1.017
-6.72%
jan 1, 2010
15.361
+1.258
8.92%
jan 1, 2011
15.524
+0.163
1.06%
jan 1, 2012
15.35
-0.174
-1.12%
jan 1, 2013
14.438
-0.911
-5.94%
jan 1, 2014
13.895
-0.543
-3.76%
jan 1, 2015
14.314
+0.418
3.01%
Ranking of countries by current statistics by years