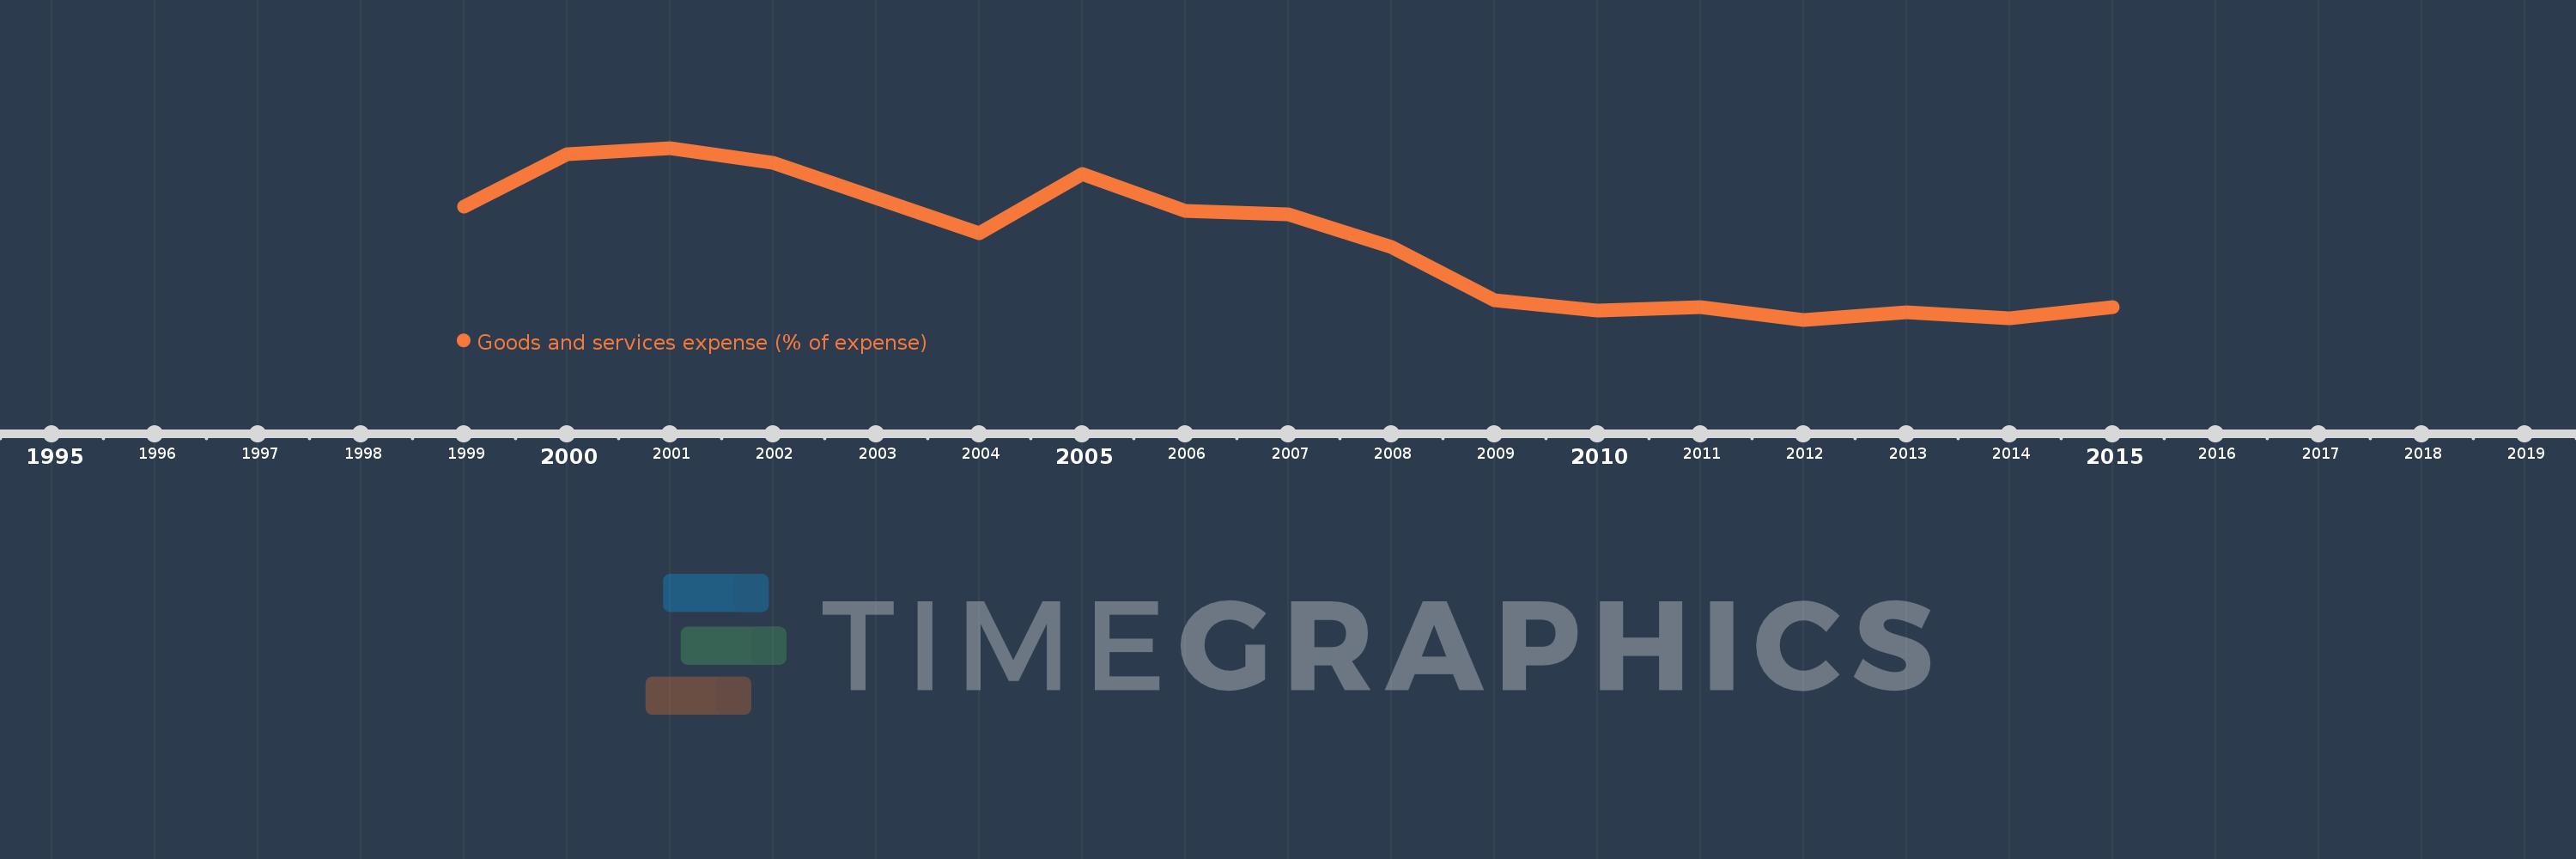
This timeline shows a graph from 1999 to 2015 of Europe & Central Asia (excluding high income). No data until 1998. Number of actual observations by date: 16.
Source name:
World Development Indicators
Source organization:
International Monetary Fund, Government Finance Statistics Yearbook and data files.
Categories, topics:
Public Sector
Last updated:
apr 23, 2017
Indicators value changes by year
Meaning:
16.853
Minimum:
11.808
jan 1, 2012
Maximum:
23.475
jan 1, 2001
At the date of observation
Value
Absolute change
Change from the previous value
jan 1, 1999
19.485
+19.485
0.0%
jan 1, 2000
23.031
+3.546
18.2%
jan 1, 2001
23.475
+0.444
1.93%
jan 1, 2002
22.461
-1.014
-4.32%
jan 1, 2004
17.673
-4.789
-21.32%
jan 1, 2005
21.713
+4.04
22.86%
jan 1, 2006
19.208
-2.505
-11.54%
jan 1, 2007
18.962
-0.246
-1.28%
jan 1, 2008
16.725
-2.237
-11.8%
jan 1, 2009
13.135
-3.591
-21.47%
jan 1, 2010
12.426
-0.708
-5.39%
jan 1, 2011
12.656
+0.229
1.85%
jan 1, 2012
11.808
-0.848
-6.7%
jan 1, 2013
12.318
+0.51
4.32%
jan 1, 2014
11.9
-0.418
-3.4%
jan 1, 2015
12.668
+0.769
6.46%
Ranking of countries by current statistics by years