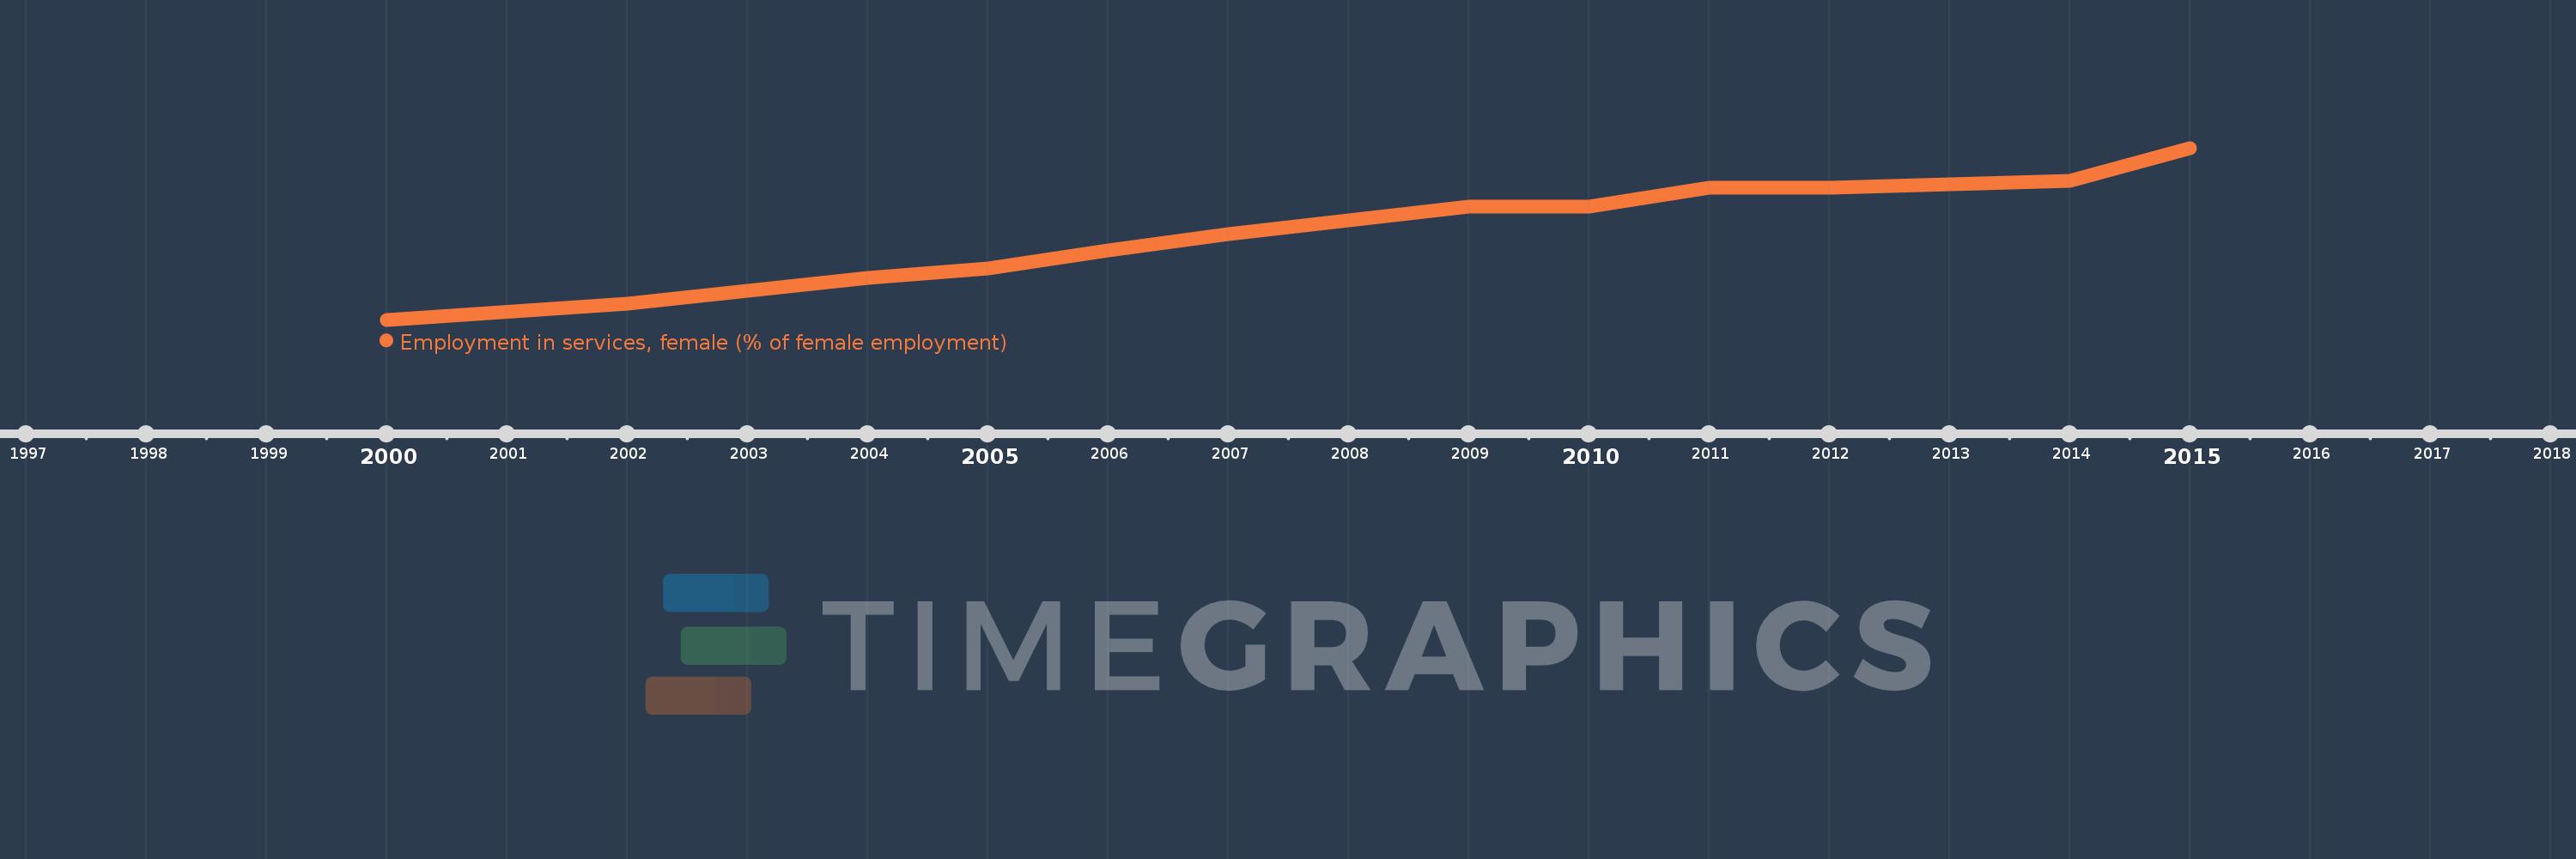
This timeline shows a graph from 2000 to 2015 of Europe & Central Asia (excluding high income). No data until 1999. Number of actual observations by date: 15.
Source name:
World Development Indicators
Source organization:
International Labour Organization, Key Indicators of the Labour Market database.
Categories, topics:
Social Protection & Labor, Gender
Last updated:
apr 23, 2017
Indicators value changes by year
Meaning:
63.875
Minimum:
55.548
jan 1, 2000
Maximum:
71.695
jan 1, 2015
At the date of observation
Value
Absolute change
Change from the previous value
jan 1, 2000
55.548
+55.548
0.0%
jan 1, 2002
57.051
+1.504
2.71%
jan 1, 2003
58.243
+1.191
2.09%
jan 1, 2004
59.5
+1.257
2.16%
jan 1, 2005
60.348
+0.848
1.42%
jan 1, 2006
62.066
+1.718
2.85%
jan 1, 2007
63.603
+1.538
2.48%
jan 1, 2008
64.904
+1.301
2.05%
jan 1, 2009
66.215
+1.311
2.02%
jan 1, 2010
66.168
-0.047
-0.07%
jan 1, 2011
67.967
+1.799
2.72%
jan 1, 2012
67.936
-0.031
-0.05%
jan 1, 2013
68.284
+0.348
0.51%
jan 1, 2014
68.6
+0.316
0.46%
jan 1, 2015
71.695
+3.095
4.51%
Ranking of countries by current statistics by years