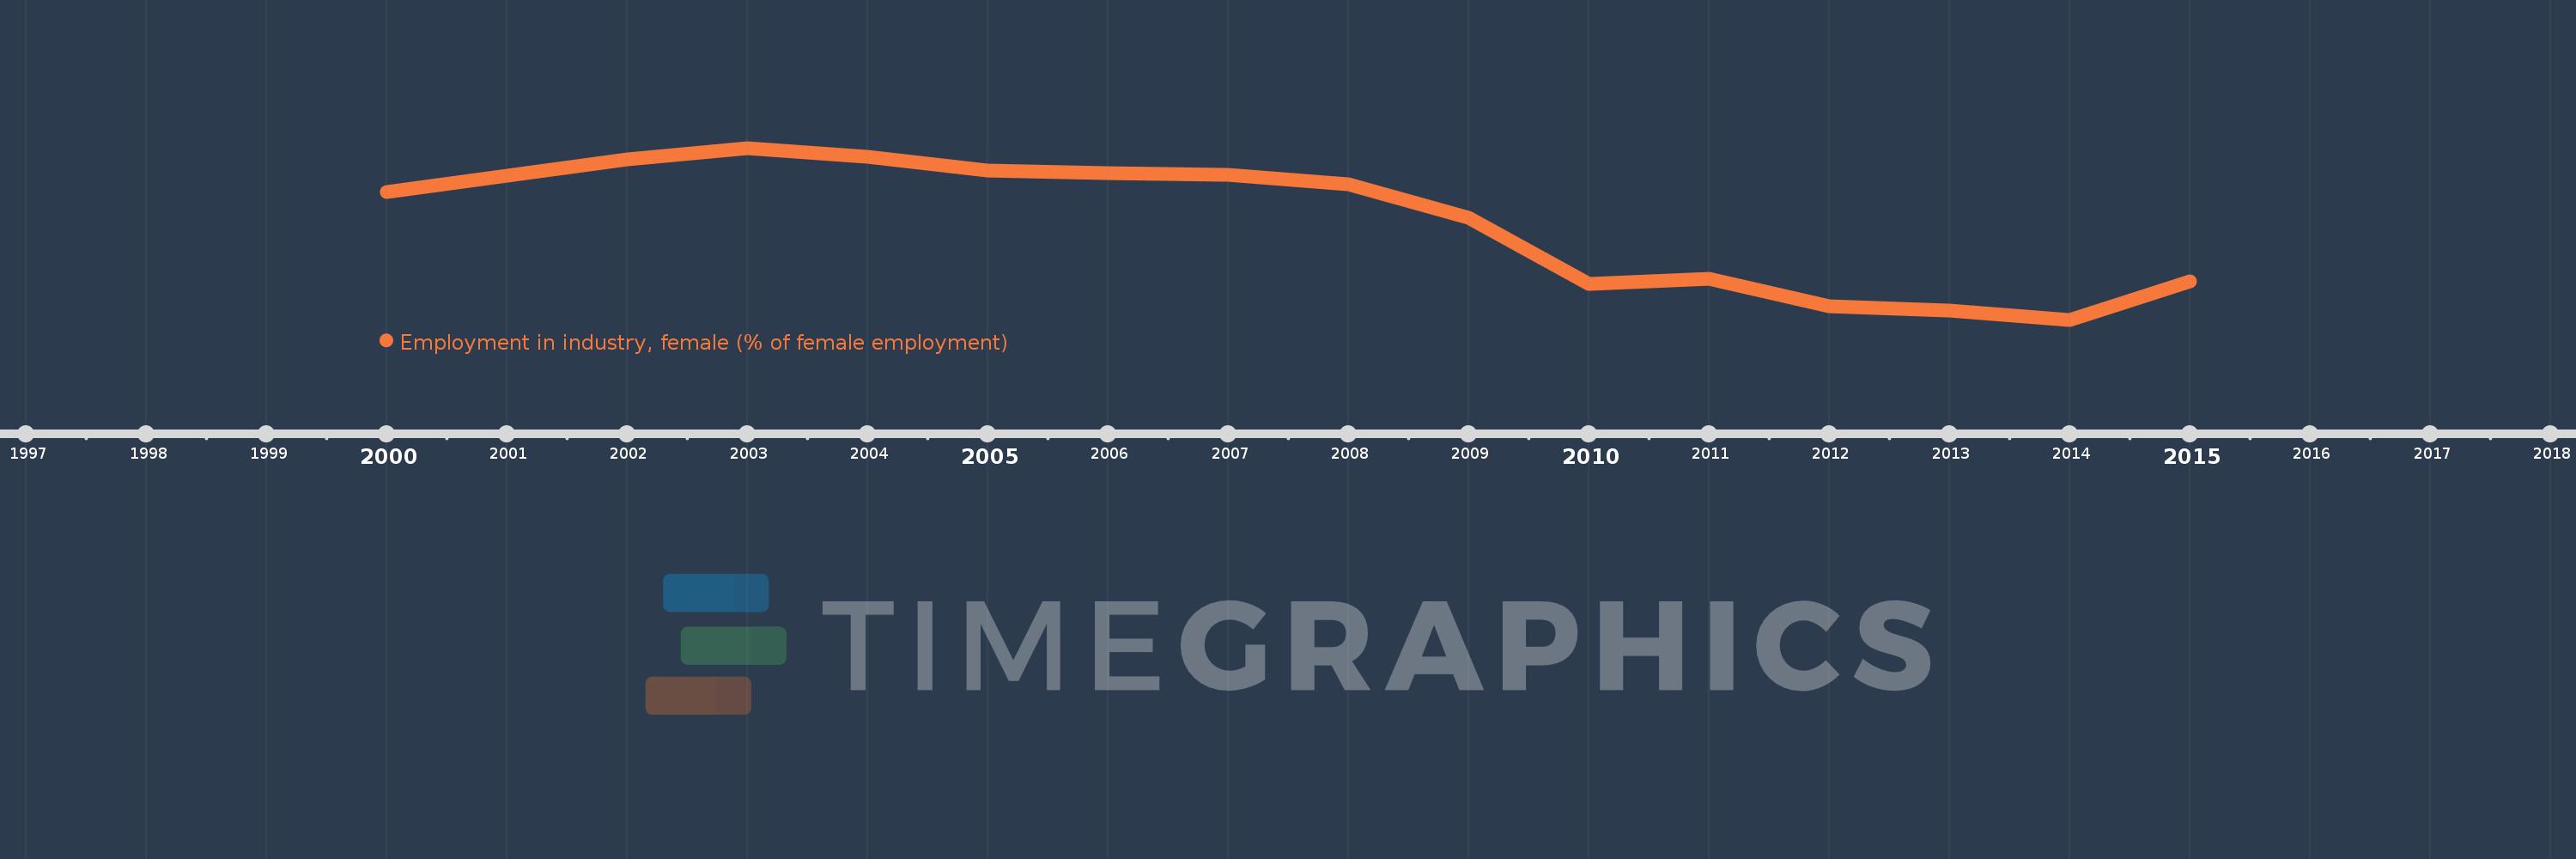
This timeline shows a graph from 2000 to 2015 of Europe & Central Asia (excluding high income). No data until 1999. Number of actual observations by date: 15.
Source name:
World Development Indicators
Source organization:
International Labour Organization, Key Indicators of the Labour Market database.
Categories, topics:
Social Protection & Labor, Gender
Last updated:
apr 23, 2017
Indicators value changes by year
Meaning:
18.231
Minimum:
15.957
jan 1, 2014
Maximum:
20.029
jan 1, 2003
At the date of observation
Value
Absolute change
Change from the previous value
jan 1, 2000
18.985
+18.985
0.0%
jan 1, 2002
19.767
+0.781
4.12%
jan 1, 2003
20.029
+0.263
1.33%
jan 1, 2004
19.829
-0.2
-1.0%
jan 1, 2005
19.501
-0.327
-1.65%
jan 1, 2006
19.43
-0.071
-0.36%
jan 1, 2007
19.397
-0.034
-0.17%
jan 1, 2008
19.165
-0.232
-1.2%
jan 1, 2009
18.377
-0.788
-4.11%
jan 1, 2010
16.798
-1.579
-8.59%
jan 1, 2011
16.922
+0.125
0.74%
jan 1, 2012
16.273
-0.649
-3.84%
jan 1, 2013
16.175
-0.098
-0.6%
jan 1, 2014
15.957
-0.218
-1.35%
jan 1, 2015
16.862
+0.904
5.67%
Ranking of countries by current statistics by years