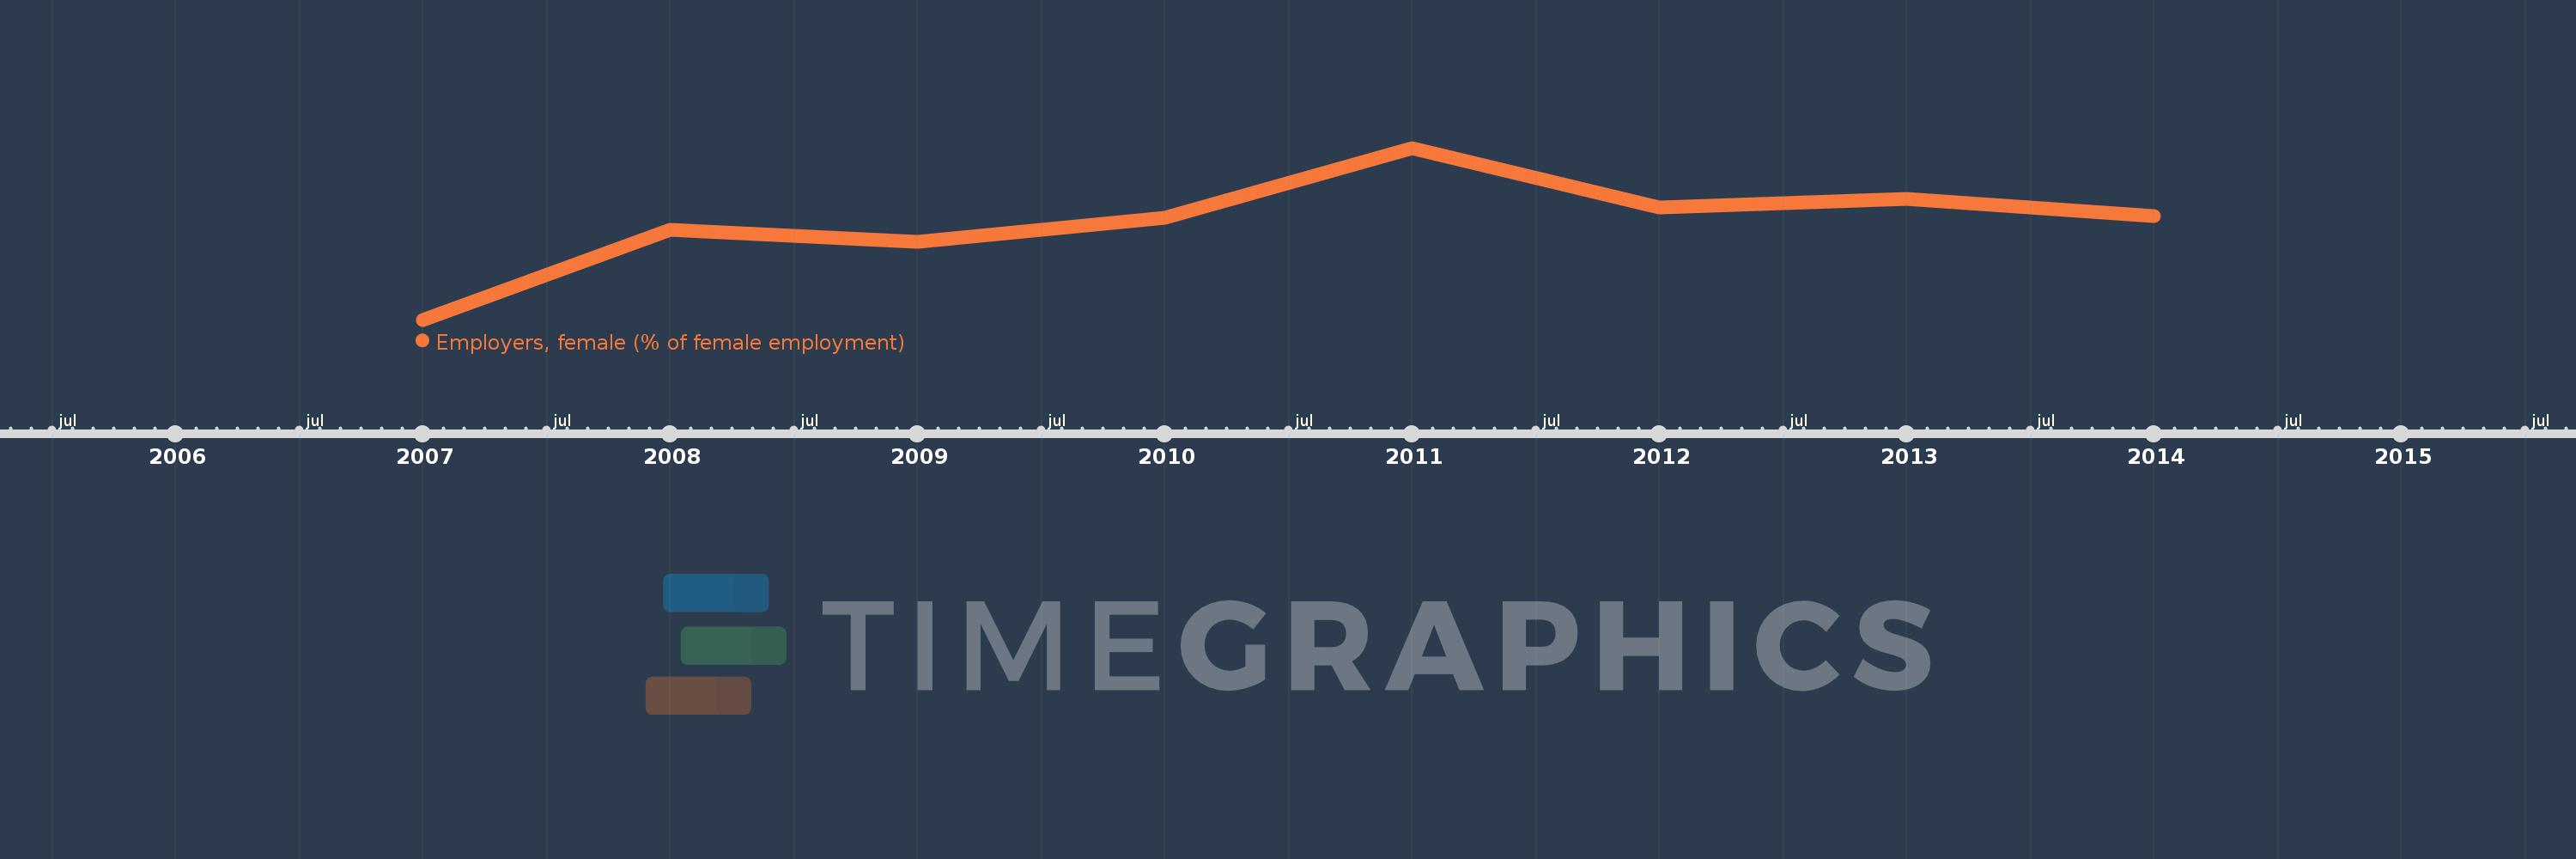
This timeline shows a graph from 2007 to 2014 of Europe & Central Asia (excluding high income). No data until 2006. Number of actual observations by date: 8.
Source name:
World Development Indicators
Source organization:
ILO Key Indicators of the Labour Market (KILM).
Categories, topics:
Social Protection & Labor, Gender
Last updated:
apr 23, 2017
Indicators value changes by year
Meaning:
1.191
Minimum:
1.001
jan 1, 2007
Maximum:
1.336
jan 1, 2011
At the date of observation
Value
Absolute change
Change from the previous value
jan 1, 2007
1.001
+1.001
0.0%
jan 1, 2008
1.177
+0.176
17.63%
jan 1, 2009
1.153
-0.024
-2.08%
jan 1, 2010
1.2
+0.048
4.13%
jan 1, 2011
1.336
+0.136
11.32%
jan 1, 2012
1.22
-0.116
-8.69%
jan 1, 2013
1.237
+0.017
1.39%
jan 1, 2014
1.204
-0.033
-2.66%
Ranking of countries by current statistics by years