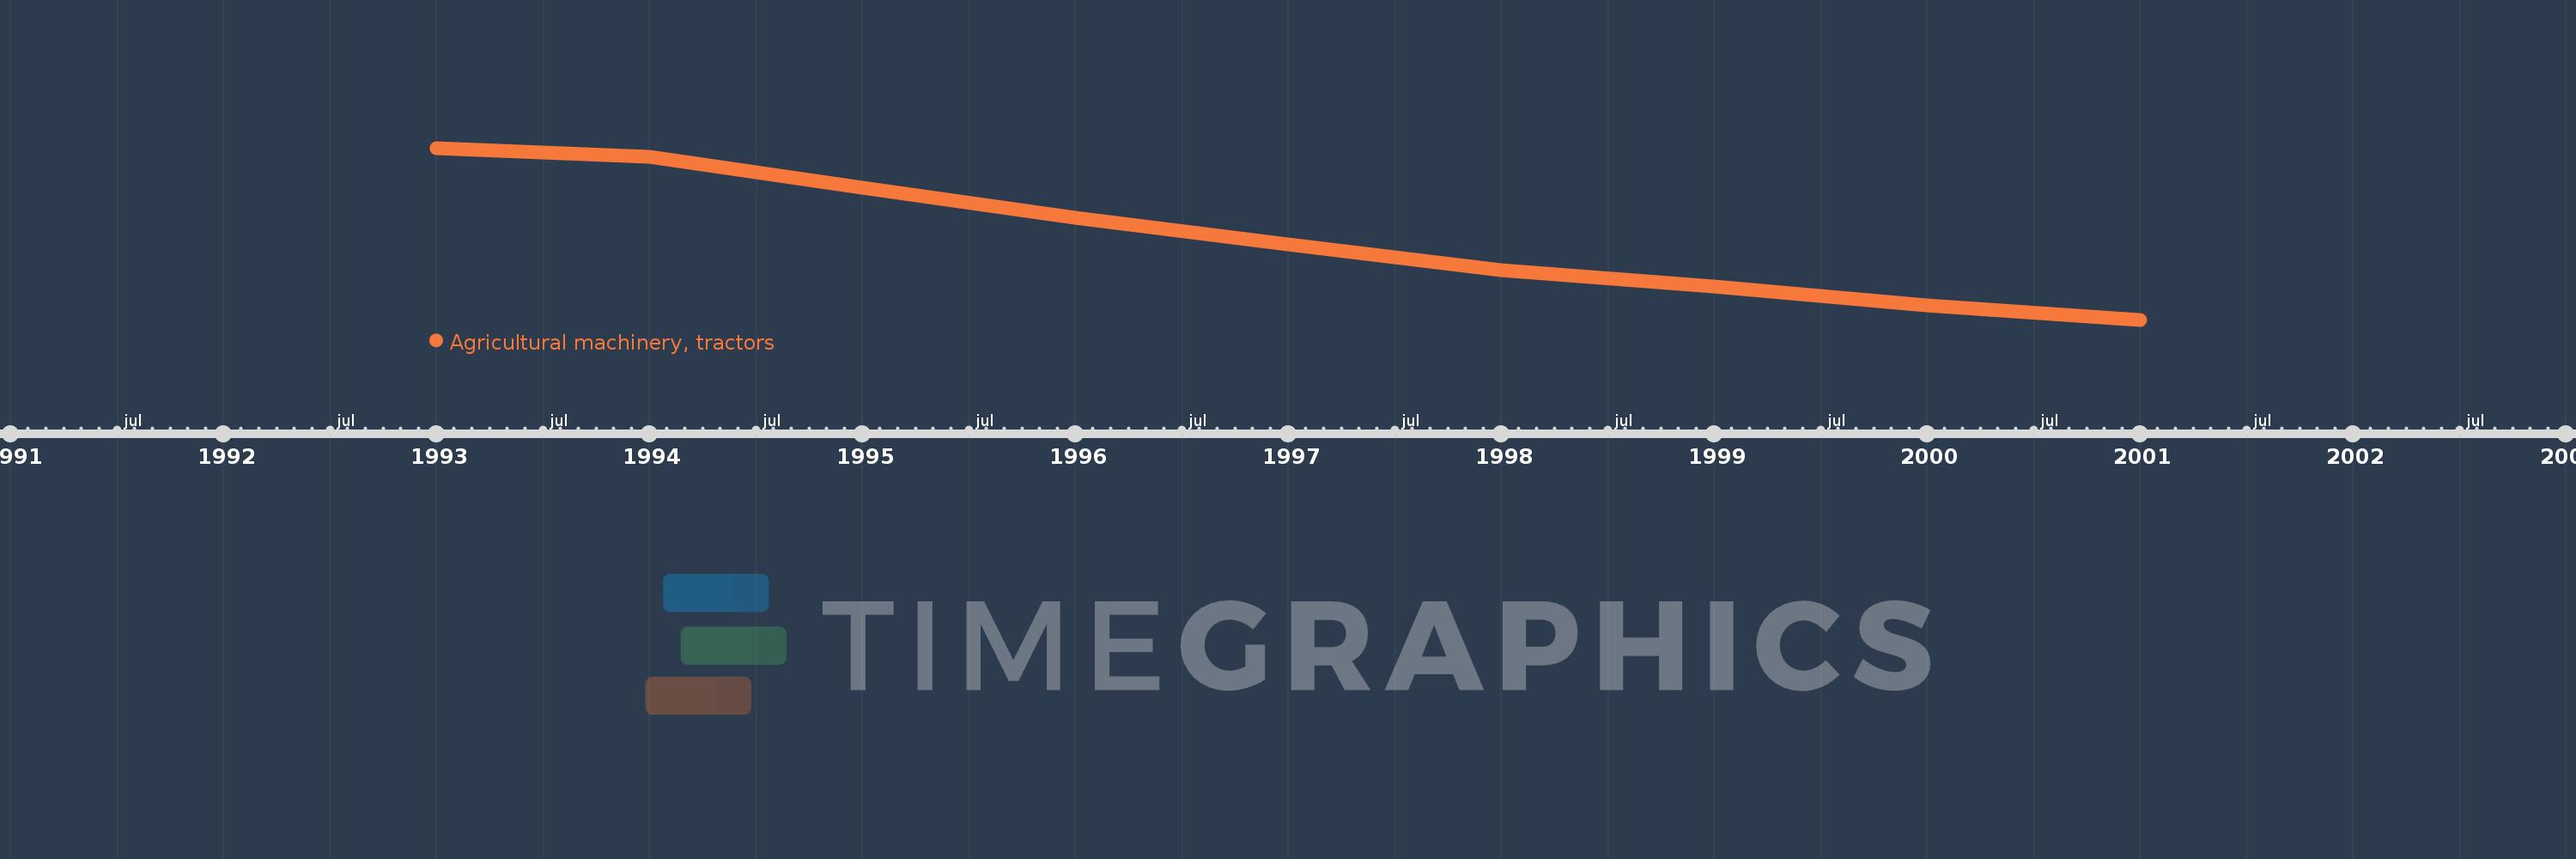
This timeline shows a graph from 1993 to 2001 of Europe & Central Asia (excluding high income). No data until 1992. Number of actual observations by date: 9.
Source name:
World Development Indicators
Source organization:
Food and Agriculture Organization, electronic files and web site.
Categories, topics:
Agriculture & Rural Development
Last updated:
apr 23, 2017
Indicators value changes by year
Meaning:
2.946 mln
Minimum:
2.539 mln
jan 1, 2001
Maximum:
3.388 mln
jan 1, 1993
At the date of observation
Value
Absolute change
Change from the previous value
jan 1, 1993
3.388 mln
+3.388 mln
0.0%
jan 1, 1994
3.343 mln
-44.423K
-1.31%
jan 1, 1995
3.192 mln
-151.368K
-4.53%
jan 1, 1996
3.043 mln
-148.941K
-4.67%
jan 1, 1997
2.91 mln
-132.465K
-4.35%
jan 1, 1998
2.785 mln
-125.02K
-4.3%
jan 1, 1999
2.704 mln
-81.666K
-2.93%
jan 1, 2000
2.61 mln
-93.195K
-3.45%
jan 1, 2001
2.539 mln
-71.85K
-2.75%
Ranking of countries by current statistics by years