33
/
AIzaSyB4mHJ5NPEv-XzF7P6NDYXjlkCWaeKw5bc
November 30, 2025
30158
Euro area
EMU
false
2
1
Net trade in goods and services (BoP, current US$)
2016,2015,2014,2013,2012,2011,2010,2009,2008,2007,2006,2005,2004,2003,2002,2001
Create a timeline
Public Timelines
For education
For educational institutions
For teachers
For students
Cabinet
For educational institutions
For teachers
For students
Open cabinet
FAQ
Close
Create a timeline
Public timelines
FAQ
About & Feedback
Terms
Privacy
FAQ
Support 24/7
Cabinet
Get premium
Donate
Download
Global statistics library
→
Euro area
→
Net trade in goods and services (BoP, current US$)
This statistics in other country:
Afghanistan
Albania
Algeria
Angola
Antigua and Barbuda
Argentina
Armenia
Aruba
Australia
Austria
Azerbaijan
Bahamas, The
Bahrain
Bangladesh
Barbados
Belarus
Belgium
Belize
Benin
Bermuda
Bhutan
Bolivia
Bosnia and Herzegovina
Botswana
Brazil
Brunei Darussalam
Bulgaria
Burkina Faso
Burundi
Cabo Verde
Cambodia
Cameroon
Canada
Central African Republic
Chad
Chile
China
Colombia
Comoros
Congo, Dem. Rep.
Congo, Rep.
Costa Rica
Cote d'Ivoire
Croatia
Curacao
Cyprus
Czech Republic
Denmark
Djibouti
Dominica
Dominican Republic
Ecuador
Egypt, Arab Rep.
El Salvador
Equatorial Guinea
Eritrea
Estonia
Ethiopia
Euro area
Faroe Islands
Fiji
Finland
France
French Polynesia
Gabon
Gambia, The
Georgia
Germany
Ghana
Greece
Grenada
Guatemala
Guinea
Guinea-Bissau
Guyana
Haiti
Honduras
Hong Kong SAR, China
Hungary
Iceland
India
Indonesia
Iran, Islamic Rep.
Iraq
Ireland
Israel
Italy
Jamaica
Japan
Jordan
Kazakhstan
Kenya
Kiribati
Korea, Rep.
Kosovo
Kuwait
Kyrgyz Republic
Lao PDR
Latvia
Lebanon
Lesotho
Liberia
Libya
Lithuania
Luxembourg
Macao SAR, China
Macedonia, FYR
Madagascar
Malawi
Malaysia
Maldives
Mali
Malta
Marshall Islands
Mauritania
Mauritius
Mexico
Micronesia, Fed. Sts.
Moldova
Mongolia
Montenegro
Morocco
Mozambique
Myanmar
Namibia
Nepal
Netherlands
New Caledonia
New Zealand
Nicaragua
Niger
Nigeria
Norway
Oman
Pakistan
Palau
Panama
Papua New Guinea
Paraguay
Peru
Philippines
Poland
Portugal
Qatar
Romania
Russian Federation
Rwanda
Samoa
Sao Tome and Principe
Saudi Arabia
Senegal
Serbia
Seychelles
Sierra Leone
Singapore
Sint Maarten (Dutch part)
Slovak Republic
Slovenia
Solomon Islands
South Africa
South Sudan
Spain
Sri Lanka
St. Kitts and Nevis
St. Lucia
St. Vincent and the Grenadines
Sudan
Suriname
Swaziland
Sweden
Switzerland
Syrian Arab Republic
Tajikistan
Tanzania
Thailand
Timor-Leste
Togo
Tonga
Trinidad and Tobago
Tunisia
Turkey
Tuvalu
Uganda
Ukraine
United Kingdom
United States
Uruguay
Vanuatu
Venezuela, RB
Vietnam
West Bank and Gaza
Yemen, Rep.
Zambia
Zimbabwe
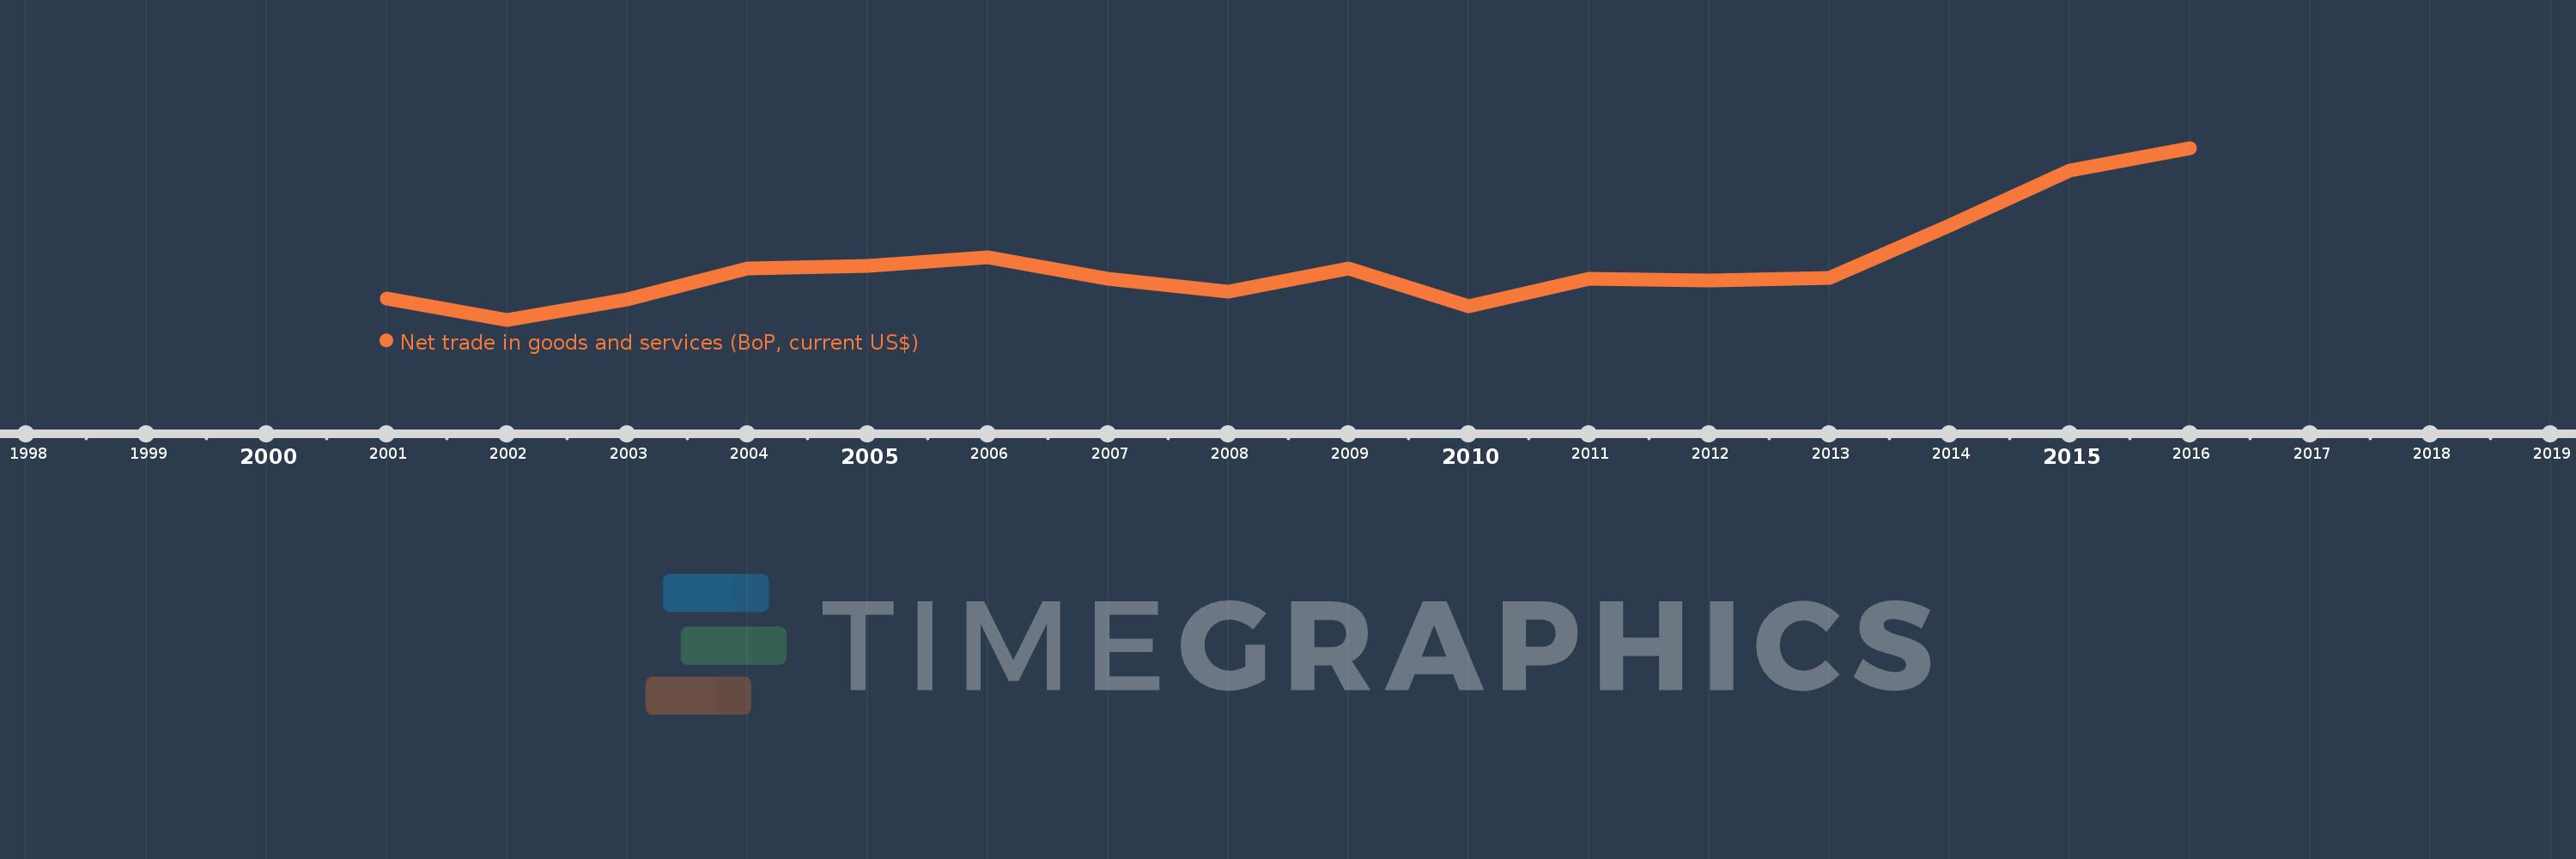
Timeline:
This timeline shows a graph from
2001
to
2016
of Euro area. No data until
2000
. Number of actual observations by date:
16
.
Source name:
World Development Indicators
Source organization:
International Monetary Fund, Balance of Payments Statistics Yearbook and data files.
Categories, topics:
Economy & Growth, Trade
Last updated:
apr 23, 2017
Indicators value changes by year
Meaning:
141.823 bln
Minimum:
7.213 bln
jan 1, 2002
Maximum:
427.423 bln
jan 1, 2016
At the date of observation
Value
Absolute change
Change from the previous value
jan 1, 2001
60.002 bln
+60.002 bln
0.0%
jan 1, 2002
7.213 bln
-52.79 bln
-87.98%
jan 1, 2003
57.821 bln
+50.608 bln
701.64%
jan 1, 2004
131.989 bln
+74.169 bln
128.27%
jan 1, 2005
138.004 bln
+6.015 bln
4.56%
jan 1, 2006
159.62 bln
+21.616 bln
15.66%
jan 1, 2007
106.441 bln
-53.179 bln
-33.32%
jan 1, 2008
75.332 bln
-31.109 bln
-29.23%
jan 1, 2009
133.687 bln
+58.355 bln
77.46%
jan 1, 2010
41.217 bln
-92.469 bln
-69.17%
jan 1, 2011
108.103 bln
+66.886 bln
162.28%
jan 1, 2012
102.809 bln
-5.294 bln
-4.9%
jan 1, 2013
110.376 bln
+7.567 bln
7.36%
jan 1, 2014
237.231 bln
+126.855 bln
114.93%
jan 1, 2015
371.899 bln
+134.668 bln
56.77%
jan 1, 2016
427.423 bln
+55.524 bln
14.93%
Ranking of countries by current statistics by years
About & Feedback
Terms
Privacy
FAQ
Support 24/7
Cabinet
Get premium
Donate
The service accepts bank transfer (ACH, Wire) or cards (Visa, MasterCard, etc). Processed by Stripe.
Secured with SSL