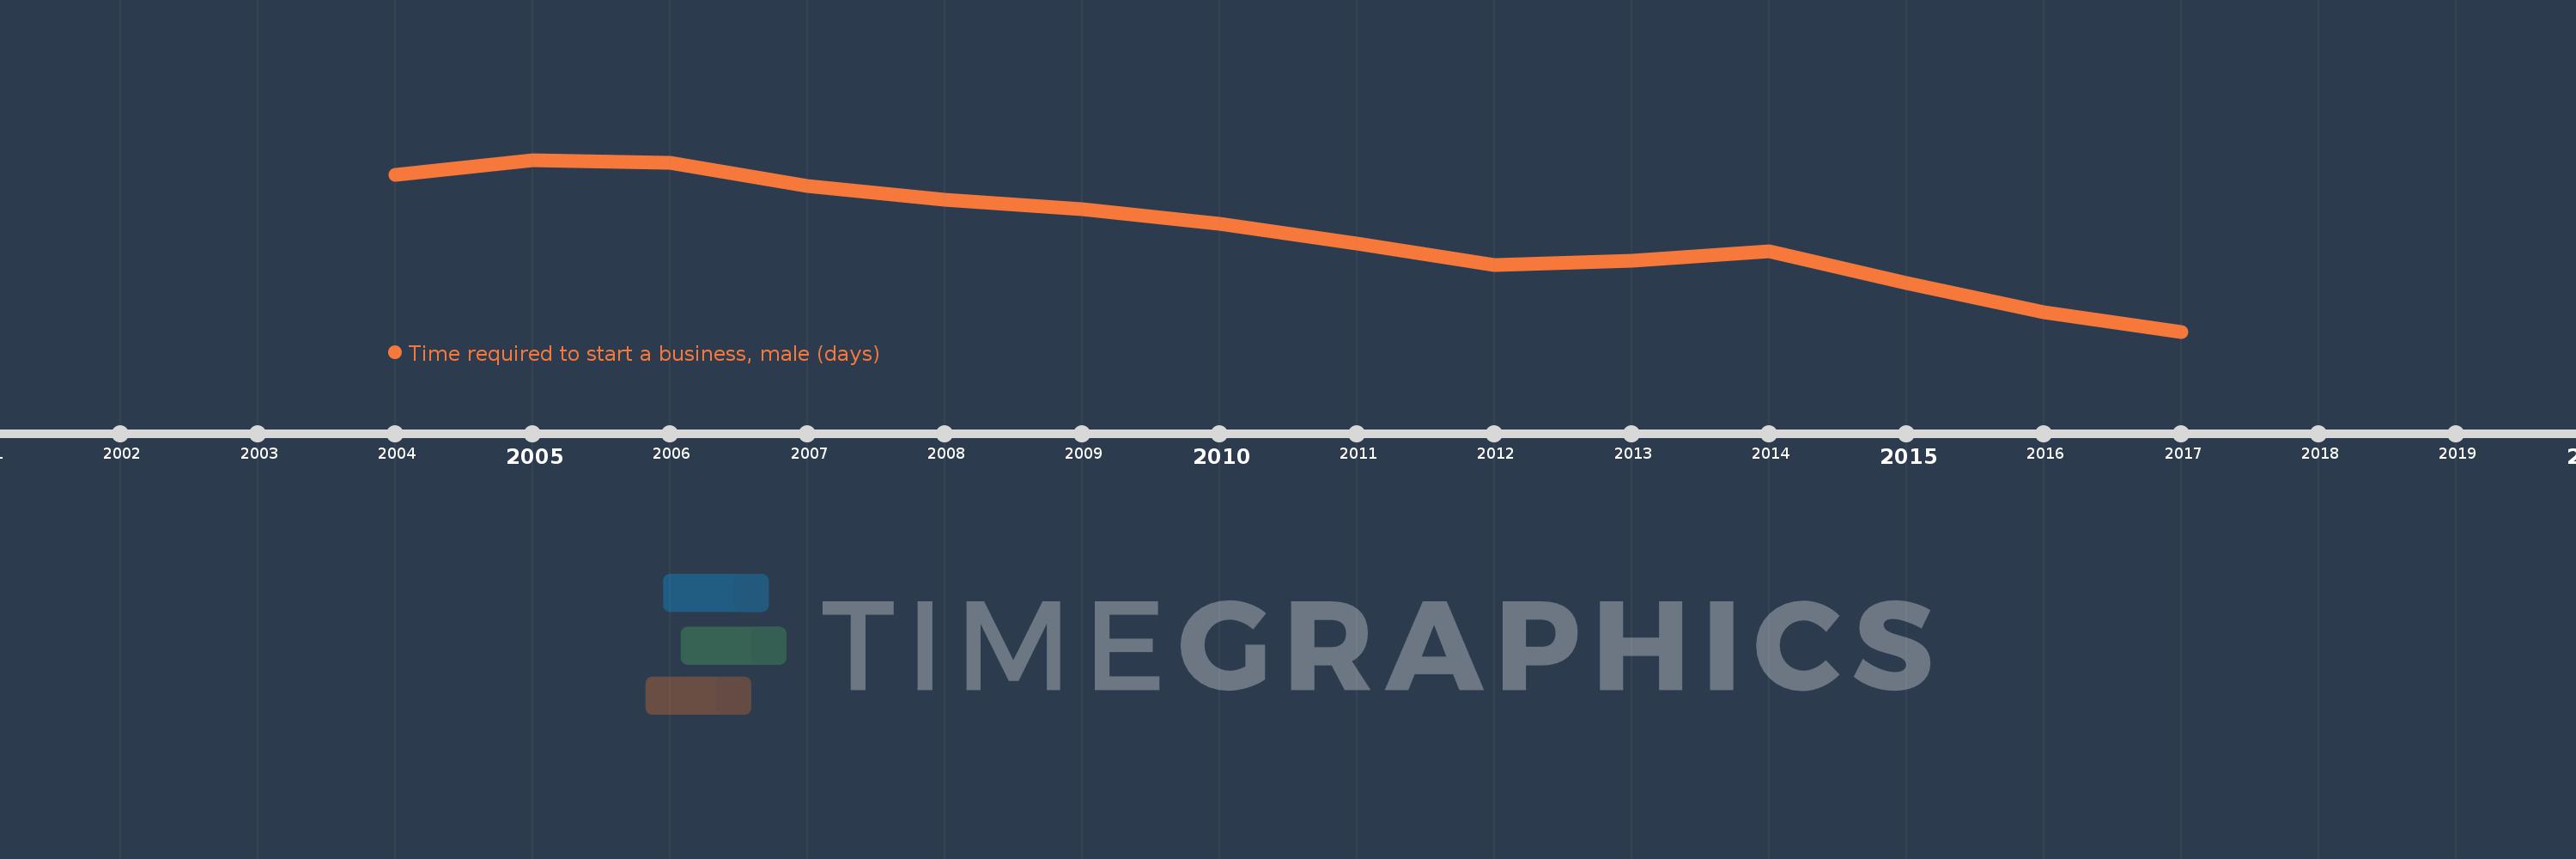
This timeline shows a graph from 2004 to 2017 of East Asia & Pacific (IDA & IBRD countries). No data until 2003. Number of actual observations by date: 14.
Source name:
World Development Indicators
Source organization:
World Bank, Doing Business project (http://www.doingbusiness.org/).
Categories, topics:
Private Sector
Last updated:
apr 23, 2017
Indicators value changes by year
Meaning:
43.992
Minimum:
27.062
jan 1, 2017
Maximum:
56.6
jan 1, 2005
At the date of observation
Value
Absolute change
Change from the previous value
jan 1, 2004
54.053
+54.053
0.0%
jan 1, 2005
56.6
+2.547
4.71%
jan 1, 2006
56.1
-0.5
-0.88%
jan 1, 2007
52.05
-4.05
-7.22%
jan 1, 2008
49.75
-2.3
-4.42%
jan 1, 2009
48.15
-1.6
-3.22%
jan 1, 2010
45.55
-2.6
-5.4%
jan 1, 2011
42.2
-3.35
-7.35%
jan 1, 2012
38.45
-3.75
-8.89%
jan 1, 2013
39.286
+0.836
2.17%
jan 1, 2014
40.829
+1.543
3.93%
jan 1, 2015
35.4
-5.429
-13.3%
jan 1, 2016
30.414
-4.986
-14.08%
jan 1, 2017
27.062
-3.352
-11.02%
Ranking of countries by current statistics by years