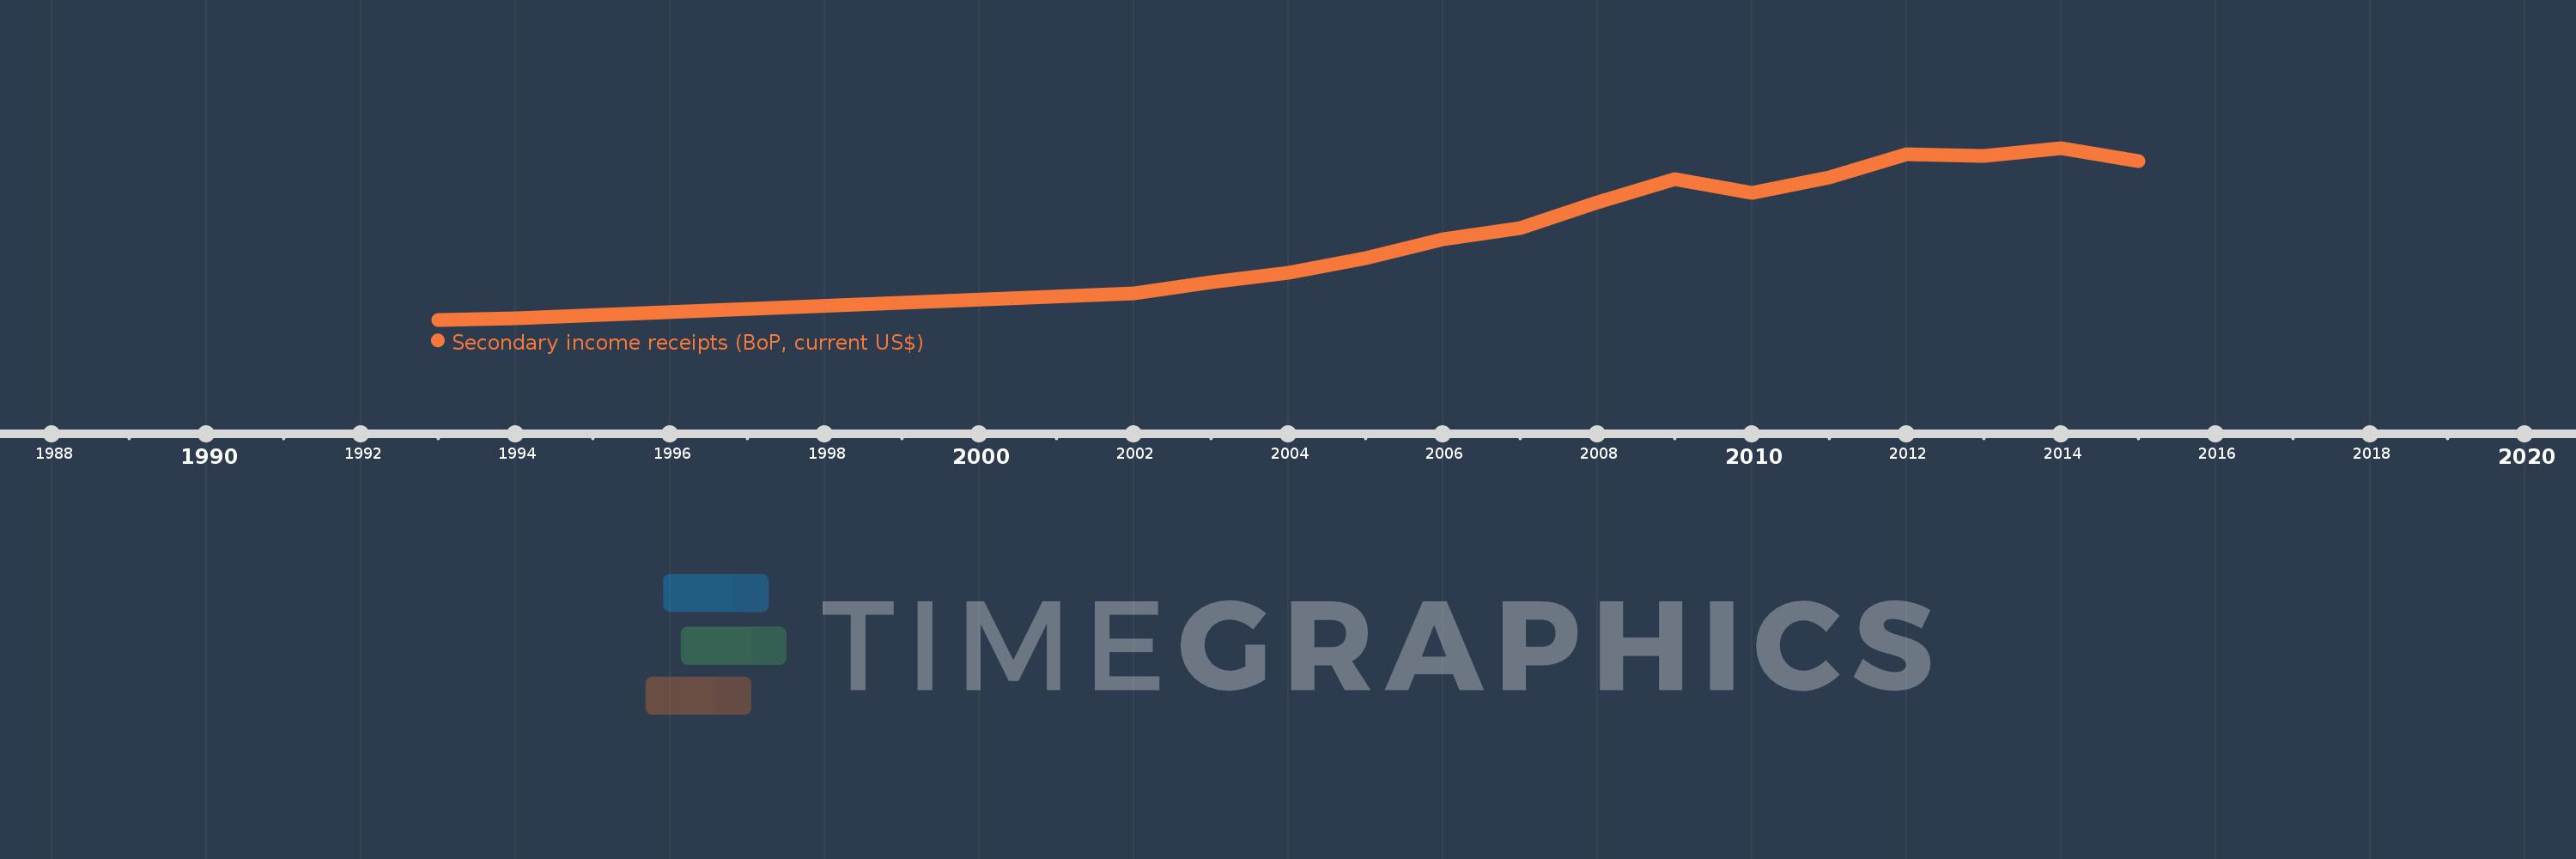
This timeline shows a graph from 1993 to 2015 of East Asia & Pacific (IDA & IBRD countries). No data until 1992. Number of actual observations by date: 16.
Source name:
World Development Indicators
Source organization:
International Monetary Fund, Balance of Payments Statistics Yearbook and data files.
Categories, topics:
Economy & Growth
Last updated:
apr 23, 2017
Indicators value changes by year
Meaning:
65.936 bln
Minimum:
4.704 bln
jan 1, 1993
Maximum:
114.485 bln
jan 1, 2014
At the date of observation
Value
Absolute change
Change from the previous value
jan 1, 1993
4.704 bln
+4.704 bln
0.0%
jan 1, 1994
5.384 bln
+679.694 mln
14.45%
jan 1, 2002
21.795 bln
+16.411 bln
304.84%
jan 1, 2003
28.793 bln
+6.998 bln
32.11%
jan 1, 2004
34.717 bln
+5.924 bln
20.57%
jan 1, 2005
44.011 bln
+9.294 bln
26.77%
jan 1, 2006
56.084 bln
+12.073 bln
27.43%
jan 1, 2007
63.297 bln
+7.213 bln
12.86%
jan 1, 2008
79.893 bln
+16.596 bln
26.22%
jan 1, 2009
94.313 bln
+14.42 bln
18.05%
jan 1, 2010
85.732 bln
-8.58 bln
-9.1%
jan 1, 2011
95.871 bln
+10.138 bln
11.83%
jan 1, 2012
110.218 bln
+14.347 bln
14.97%
jan 1, 2013
109.382 bln
-836.517 mln
-0.76%
jan 1, 2014
114.485 bln
+5.104 bln
4.67%
jan 1, 2015
106.298 bln
-8.187 bln
-7.15%
Ranking of countries by current statistics by years