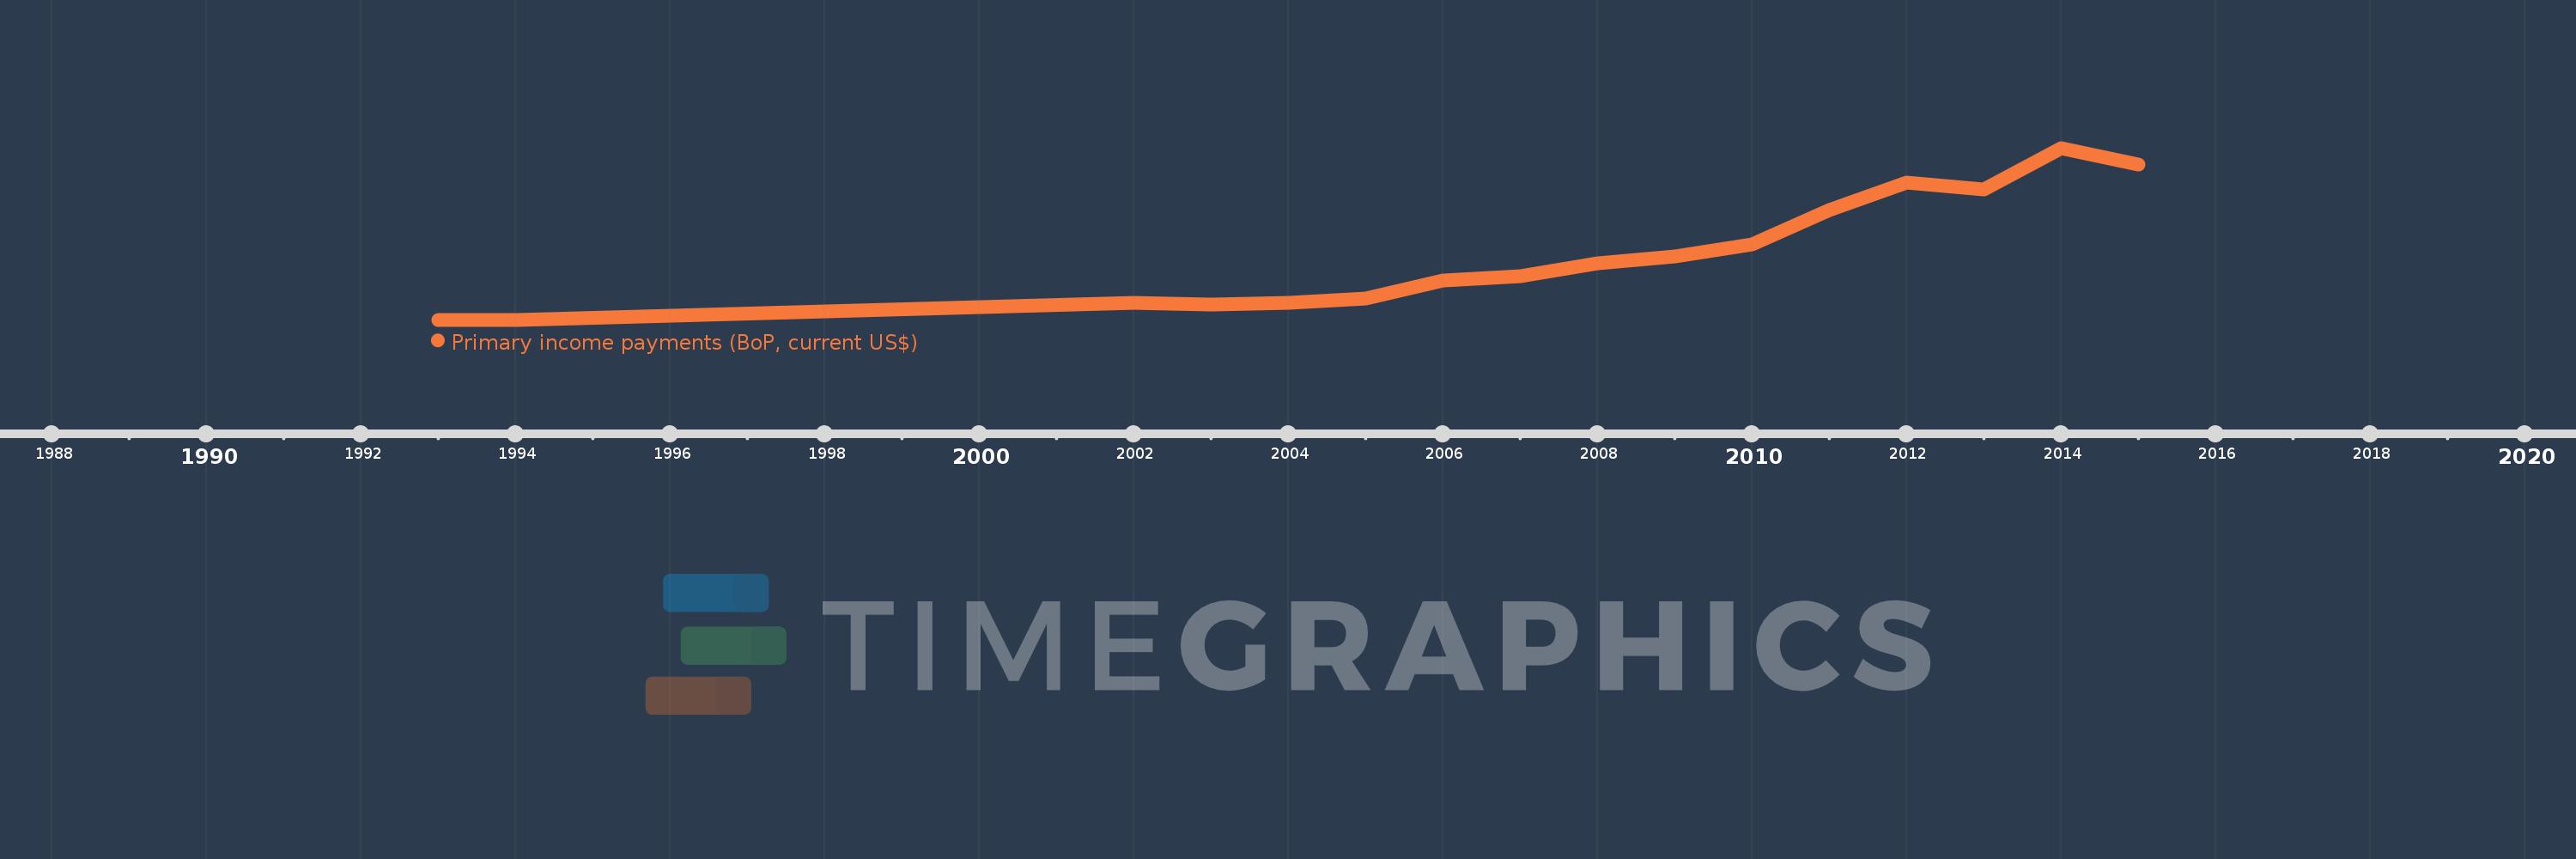
This timeline shows a graph from 1993 to 2015 of East Asia & Pacific (IDA & IBRD countries). No data until 1992. Number of actual observations by date: 16.
Source name:
World Development Indicators
Source organization:
International Monetary Fund, Balance of Payments Statistics Yearbook and data files.
Categories, topics:
Economy & Growth
Last updated:
apr 23, 2017
Indicators value changes by year
Meaning:
156.473 bln
Minimum:
22.903 bln
jan 1, 1993
Maximum:
371.718 bln
jan 1, 2014
At the date of observation
Value
Absolute change
Change from the previous value
jan 1, 1993
22.903 bln
+22.903 bln
0.0%
jan 1, 1994
22.996 bln
+93.313 mln
0.41%
jan 1, 2002
58.046 bln
+35.05 bln
152.42%
jan 1, 2003
53.356 bln
-4.69 bln
-8.08%
jan 1, 2004
57.342 bln
+3.987 bln
7.47%
jan 1, 2005
65.426 bln
+8.083 bln
14.1%
jan 1, 2006
101.878 bln
+36.453 bln
55.72%
jan 1, 2007
111.204 bln
+9.326 bln
9.15%
jan 1, 2008
136.621 bln
+25.416 bln
22.86%
jan 1, 2009
151.884 bln
+15.264 bln
11.17%
jan 1, 2010
176.477 bln
+24.592 bln
16.19%
jan 1, 2011
246.237 bln
+69.76 bln
39.53%
jan 1, 2012
300.971 bln
+54.734 bln
22.23%
jan 1, 2013
288.297 bln
-12.674 bln
-4.21%
jan 1, 2014
371.718 bln
+83.421 bln
28.94%
jan 1, 2015
338.217 bln
-33.501 bln
-9.01%
Ranking of countries by current statistics by years