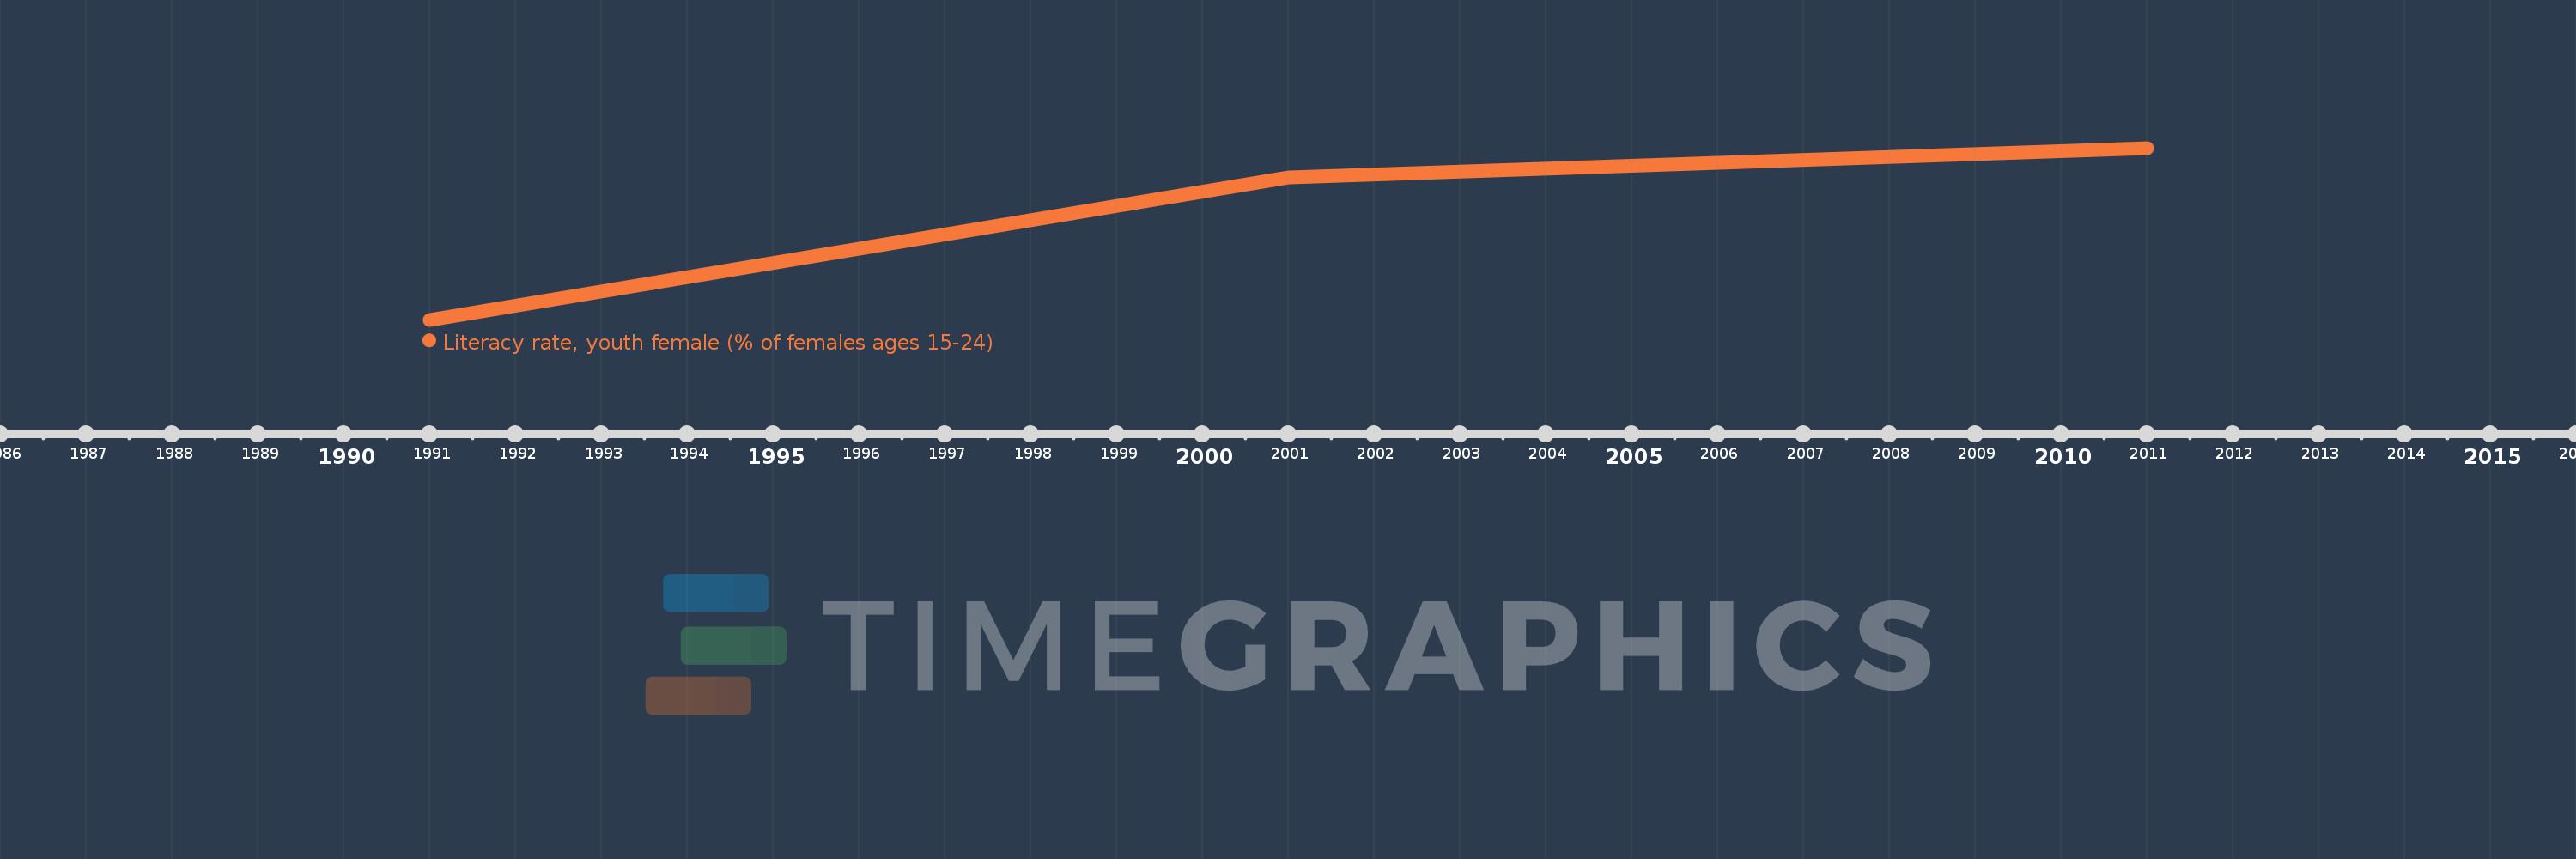
This timeline shows a graph from 1991 to 2011 of East Asia & Pacific (IDA & IBRD countries). No data until 1990. Number of actual observations by date: 3.
Source name:
World Development Indicators
Source organization:
United Nations Educational, Scientific, and Cultural Organization (UNESCO) Institute for Statistics.
Categories, topics:
Education, Gender
Last updated:
apr 23, 2017
Indicators value changes by year
Meaning:
95.78
Minimum:
90.919
jan 1, 1991
Maximum:
98.898
jan 1, 2011
At the date of observation
Value
Absolute change
Change from the previous value
jan 1, 1991
90.919
+90.919
0.0%
jan 1, 2001
97.524
+6.604
7.26%
jan 1, 2011
98.898
+1.374
1.41%
Ranking of countries by current statistics by years