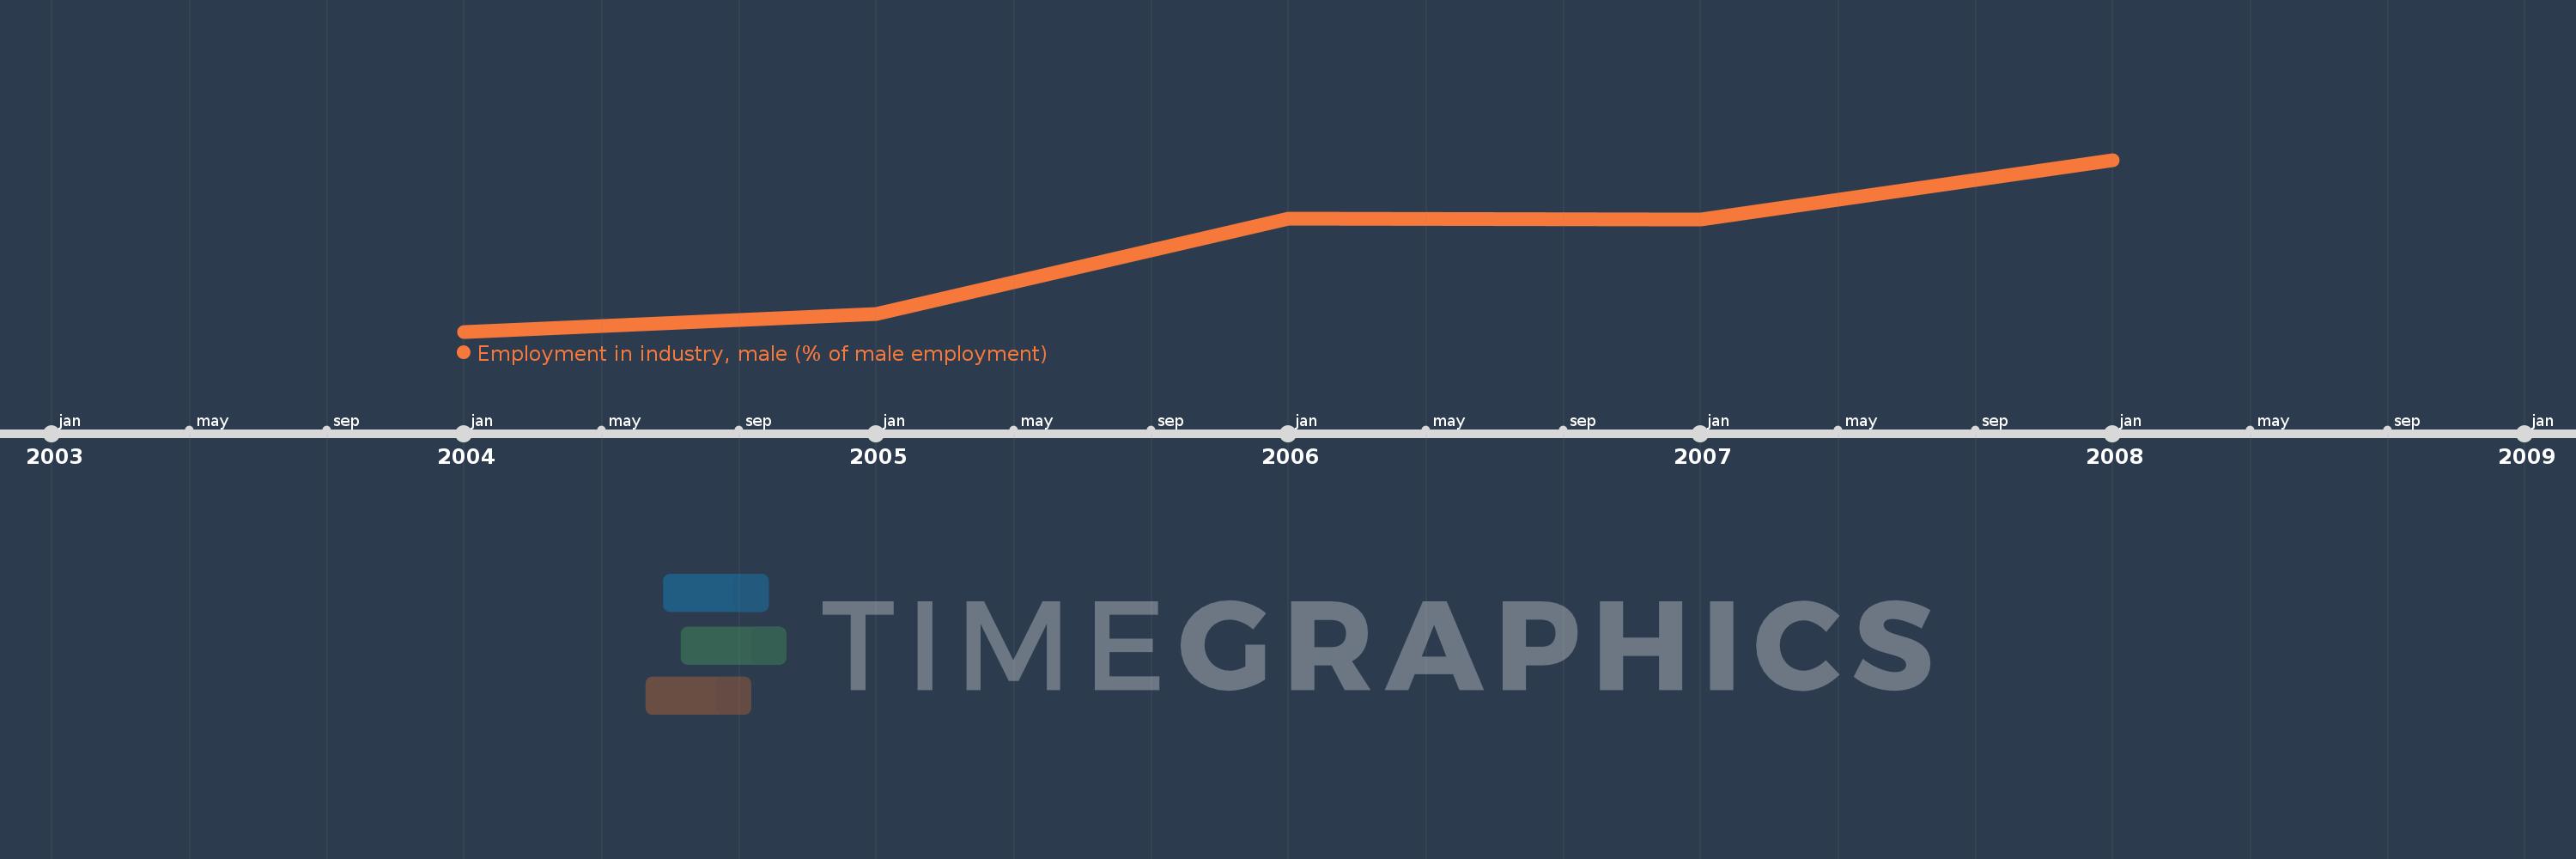
This timeline shows a graph from 2004 to 2008 of East Asia & Pacific (IDA & IBRD countries). No data until 2003. Number of actual observations by date: 5.
Source name:
World Development Indicators
Source organization:
International Labour Organization, Key Indicators of the Labour Market database.
Categories, topics:
Social Protection & Labor, Gender
Last updated:
apr 23, 2017
Indicators value changes by year
Meaning:
39.54
Minimum:
37.75
jan 1, 2004
Maximum:
41.459
jan 1, 2008
At the date of observation
Value
Absolute change
Change from the previous value
jan 1, 2004
37.75
+37.75
0.0%
jan 1, 2005
38.131
+0.381
1.01%
jan 1, 2006
40.191
+2.06
5.4%
jan 1, 2007
40.17
-0.02
-0.05%
jan 1, 2008
41.459
+1.289
3.21%
Ranking of countries by current statistics by years