33
/
AIzaSyB4mHJ5NPEv-XzF7P6NDYXjlkCWaeKw5bc
November 30, 2025
287668
Zimbabwe
ZWE
true
2
1
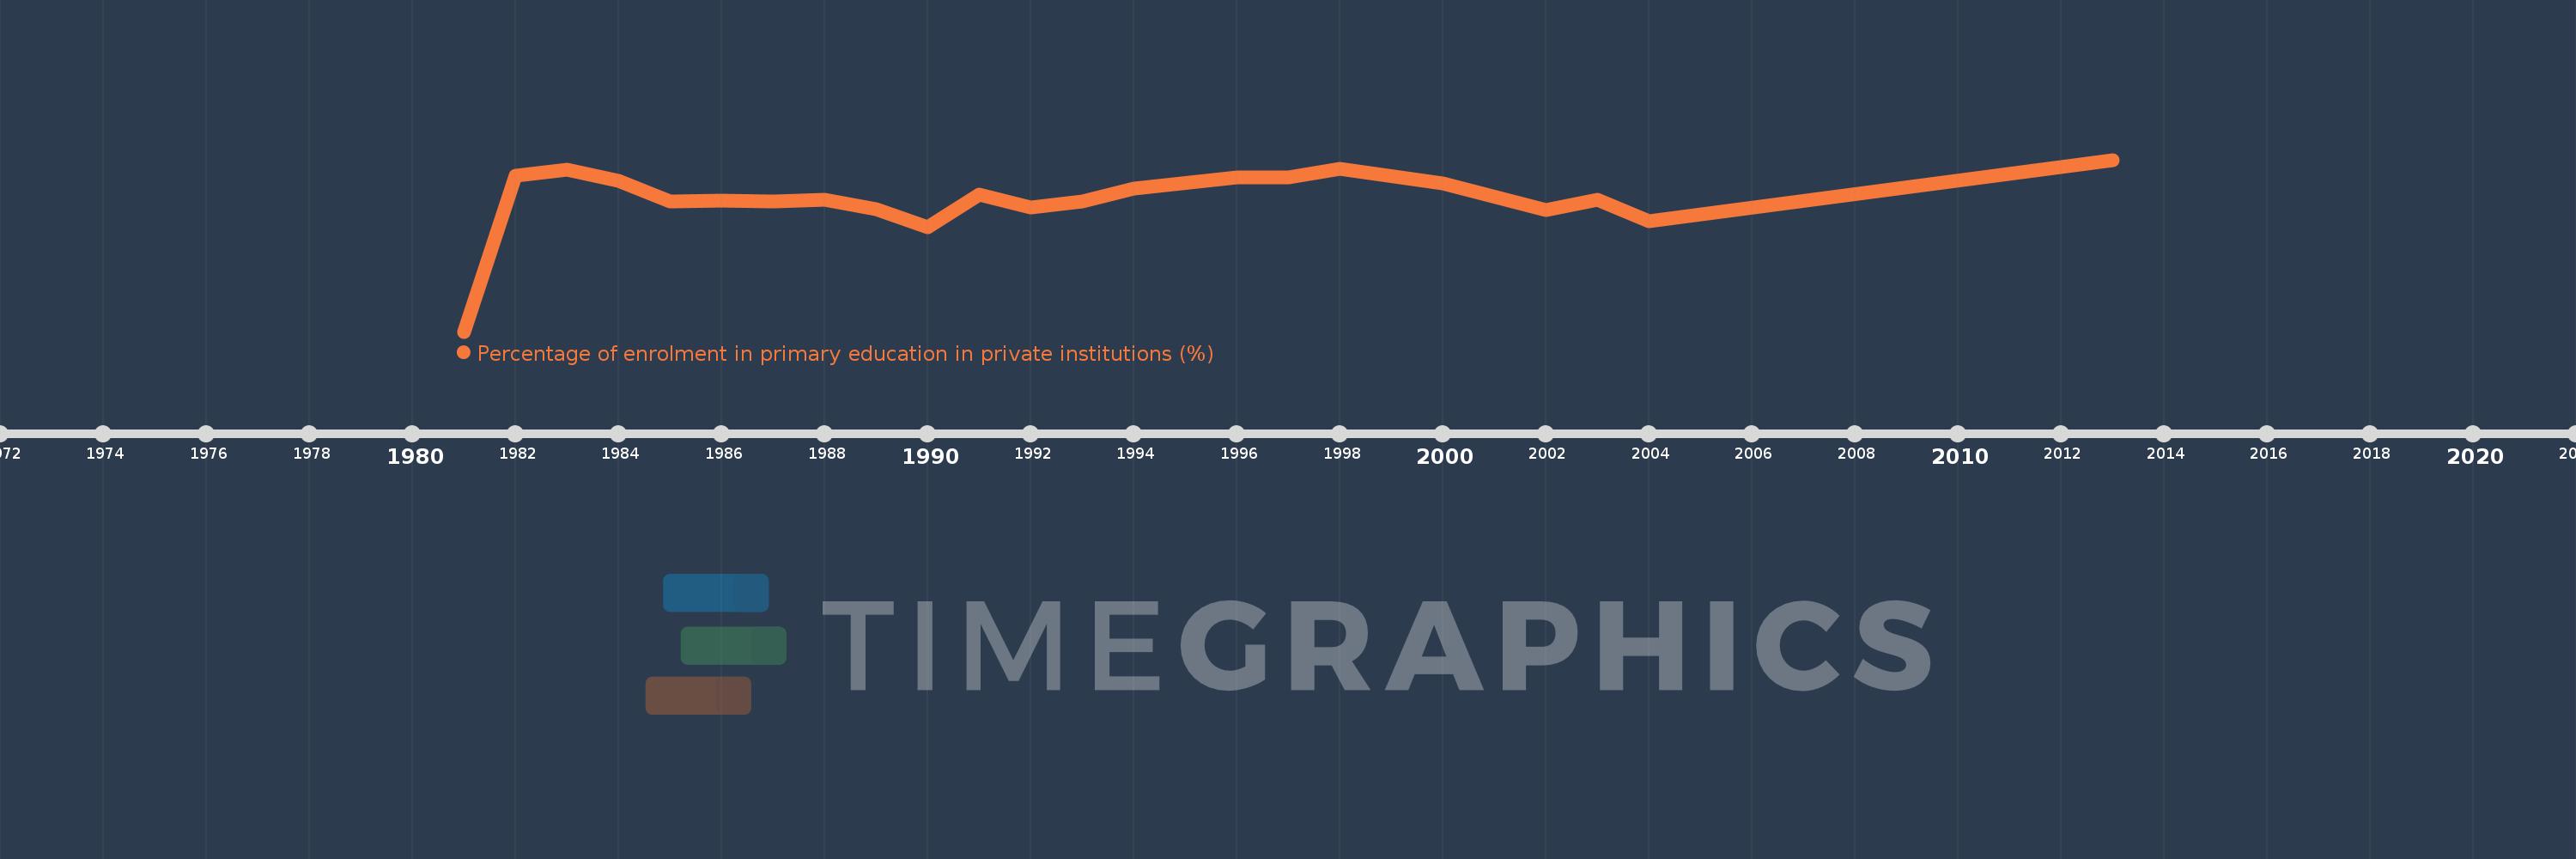
Percentage of enrolment in primary education in private institutions (%)
2013,2004,2003,2002,2000,1998,1997,1996,1994,1993,1992,1991,1990,1989,1988,1987,1986,1985,1984,1983,1982,1981