Download This statistics in other country:
Timeline:
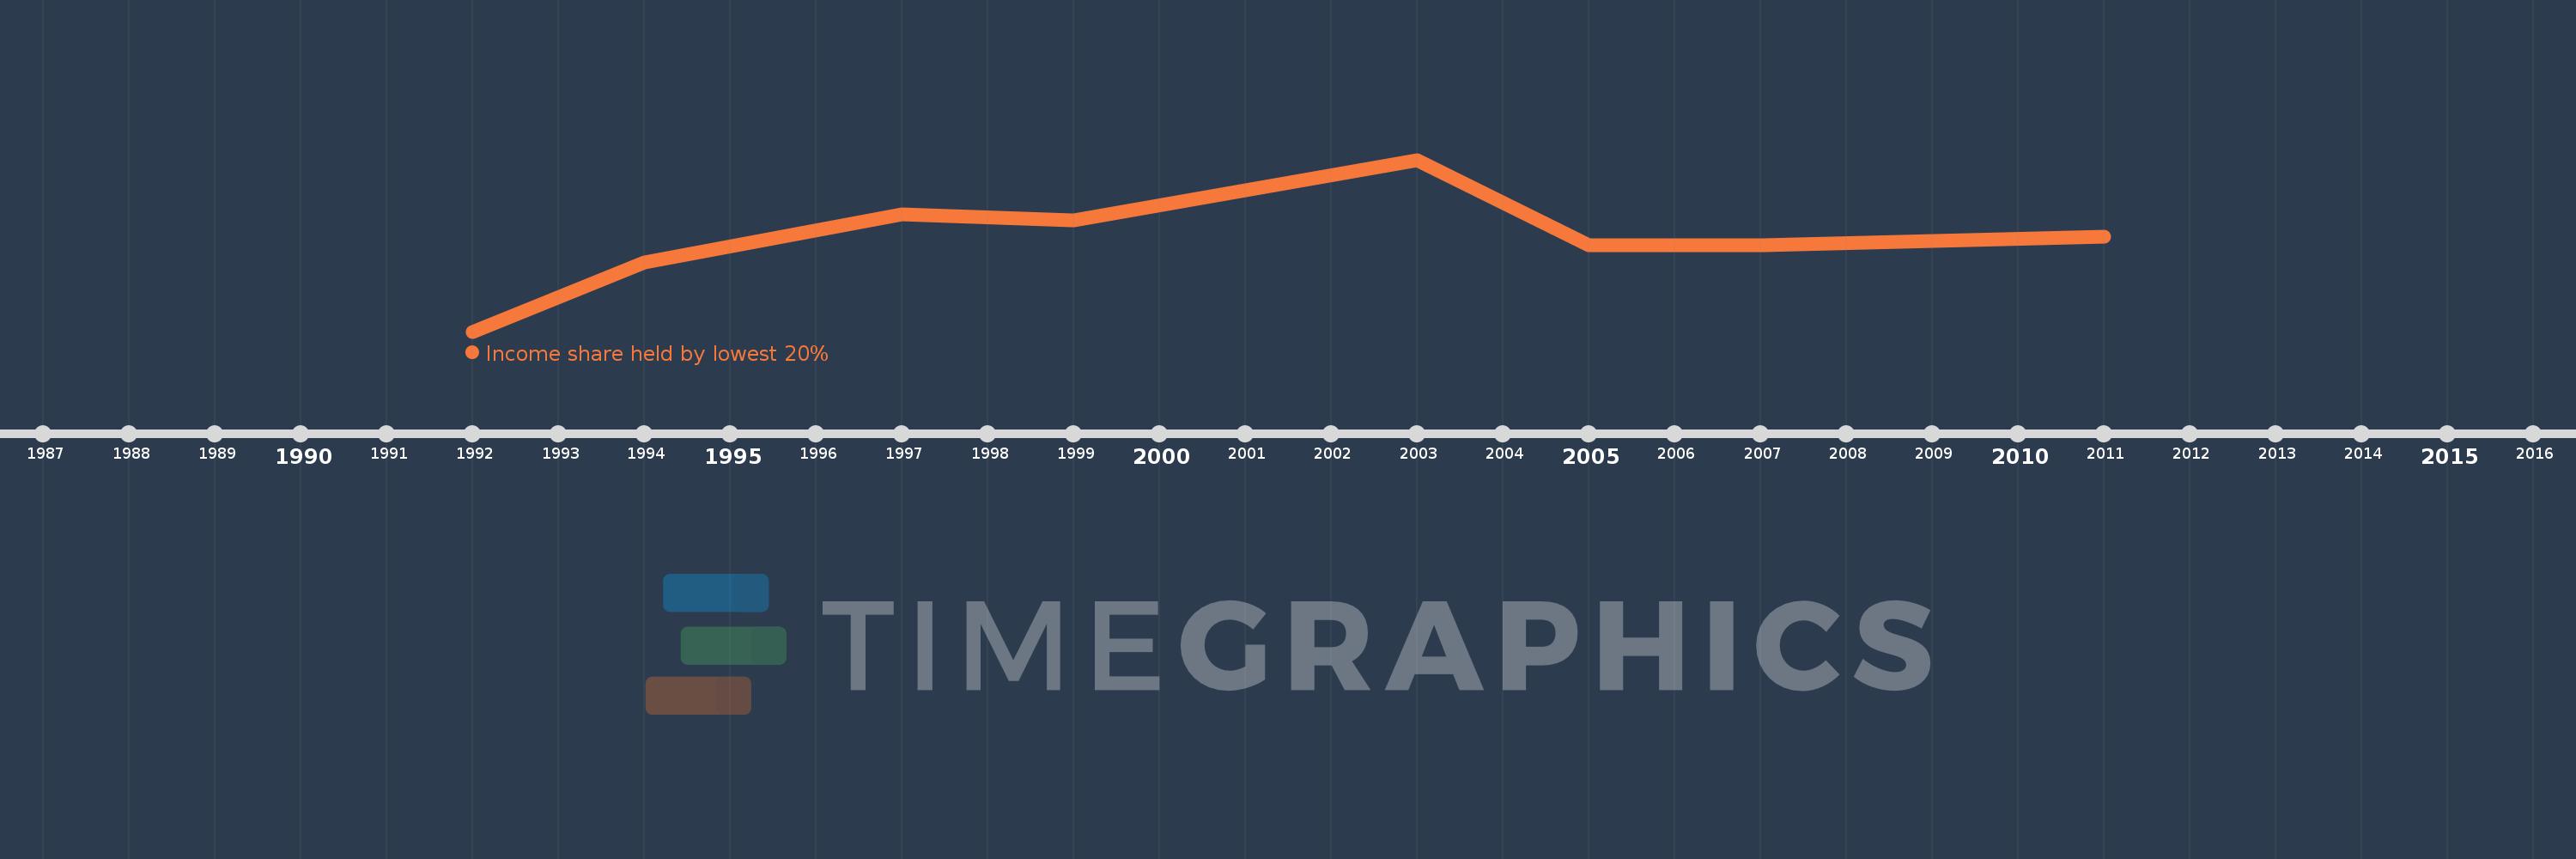
This timeline shows a graph from 1992 to 2011 of Zambia. No data until 1991. Number of actual observations by date: 8.
Source name:
World Development Indicators
Source organization:
World Bank, Development Research Group. Data are based on primary household survey data obtained from government statistical agencies and World Bank country departments. Data for high-income economies are from the Luxembourg Income Study database. For more information and methodology, please see PovcalNet (http://iresearch.worldbank.org/PovcalNet/index.htm).
Categories, topics:
Poverty, Aid Effectiveness
Last updated:
apr 23, 2017
Indicators value changes by year
At the date of observation
Value
Absolute change
Change from the previous value
jan 1, 1992
0.94
+0.94
0.0%
jan 1, 1994
3.04
+2.1
223.4%
jan 1, 1997
4.49
+1.45
47.7%
jan 1, 1999
4.31
-0.18
-4.01%
jan 1, 2003
6.13
+1.82
42.23%
jan 1, 2005
3.55
-2.58
-42.09%
jan 1, 2007
3.54
-0.01
-0.28%
jan 1, 2011
3.81
+0.27
7.63%
Ranking of countries by current statistics by years