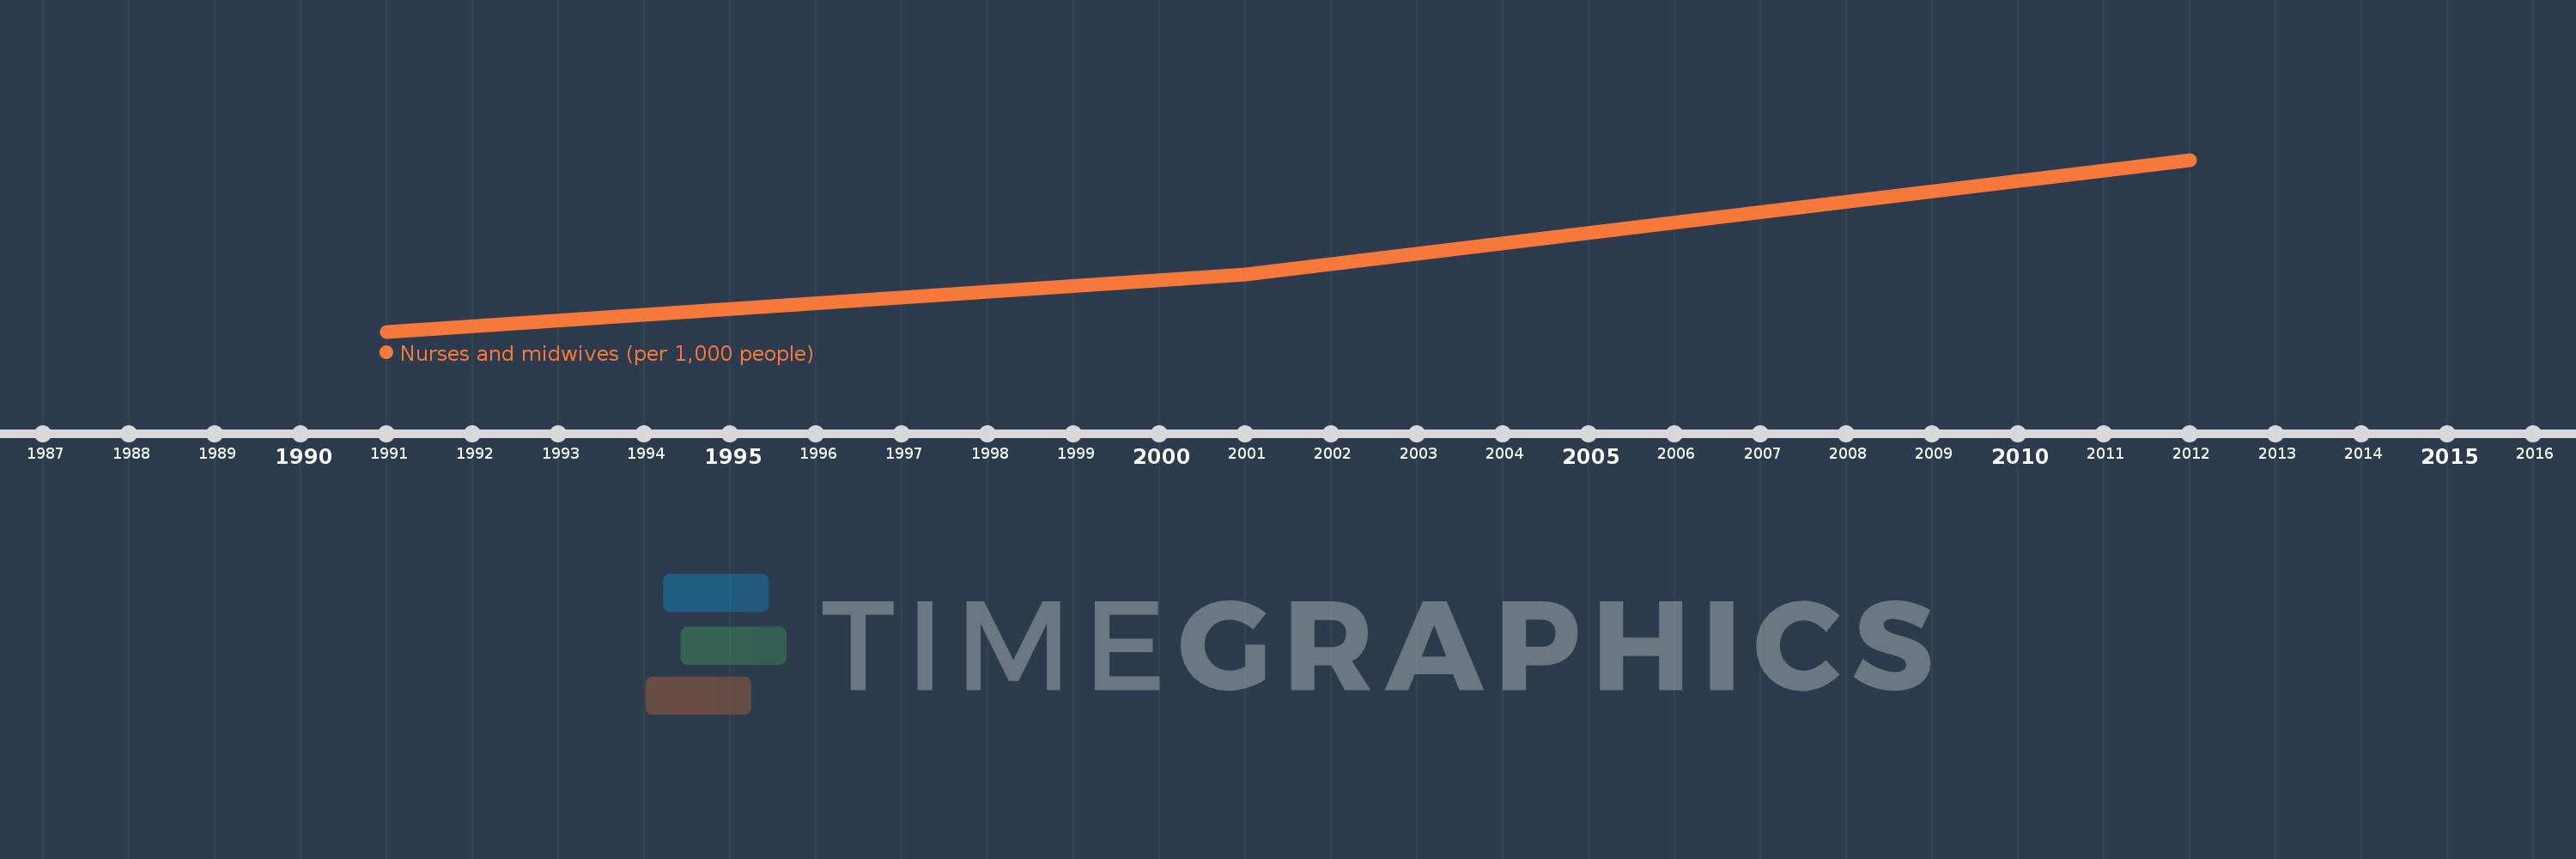
This timeline shows a graph from 1991 to 2012 of East Asia & Pacific (excluding high income). No data until 1990. Number of actual observations by date: 3.
Source name:
World Development Indicators
Source organization:
World Health Organization's Global Health Workforce Statistics, OECD, supplemented by country data.
Categories, topics:
Health
Last updated:
apr 23, 2017
Indicators value changes by year
Meaning:
1.227
Minimum:
0.807
jan 1, 1991
Maximum:
1.752
jan 1, 2012
At the date of observation
Value
Absolute change
Change from the previous value
jan 1, 1991
0.807
+0.807
0.0%
jan 1, 2001
1.123
+0.316
39.17%
jan 1, 2012
1.752
+0.63
56.08%
Ranking of countries by current statistics by years