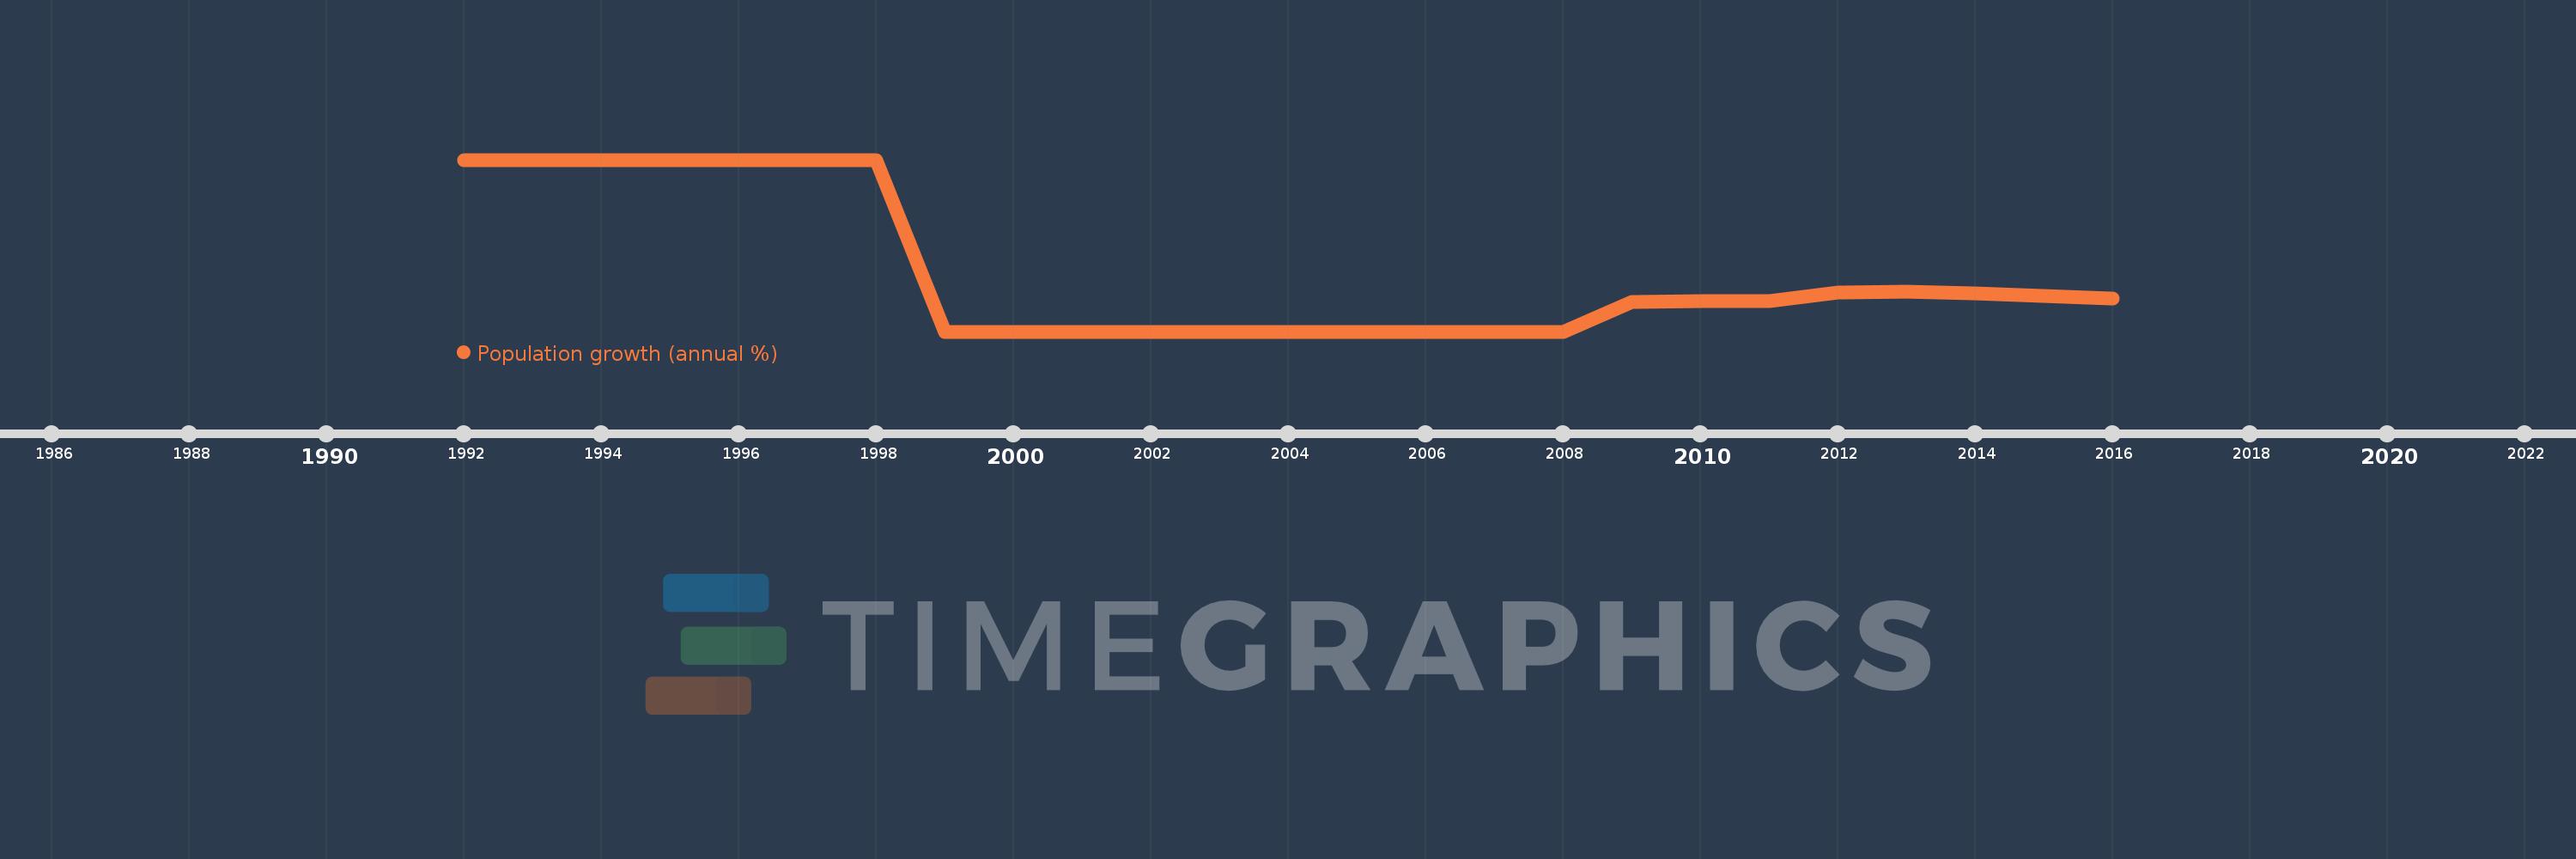
This timeline shows a graph from 1992 to 2016 of West Bank and Gaza. No data until 1991. Number of actual observations by date: 25.
Source name:
World Development Indicators
Source organization:
Derived from total population. Population source: (1) United Nations Population Division. World Population Prospects, (2) United Nations Statistical Division. Population and Vital Statistics Report (various years), (3) Census reports and other statistical
Categories, topics:
Climate Change, Health
Last updated:
apr 23, 2017
Indicators value changes by year
Meaning:
3.218
Minimum:
2.555
jan 1, 2001
Maximum:
4.478
jan 1, 1992
At the date of observation
Value
Absolute change
Change from the previous value
jan 1, 1992
4.478
+4.478
0.0%
jan 1, 1993
4.478
0.0
0.0%
jan 1, 1994
4.478
0.0
0.0%
jan 1, 1995
4.478
0.0
0.0%
jan 1, 1996
4.478
+0.0
0.0%
jan 1, 1997
4.478
+0.0
0.0%
jan 1, 1998
4.478
0.0
0.0%
jan 1, 1999
2.555
-1.923
-42.94%
jan 1, 2000
2.555
0.0
0.0%
jan 1, 2001
2.555
0.0
0.0%
jan 1, 2002
2.555
+0.0
0.0%
jan 1, 2003
2.555
+0.0
0.0%
jan 1, 2004
2.555
0.0
0.0%
jan 1, 2005
2.555
+0.0
0.0%
jan 1, 2006
2.555
0.0
0.0%
jan 1, 2007
2.555
0.0
0.0%
jan 1, 2008
2.555
0.0
0.0%
jan 1, 2009
2.882
+0.327
12.8%
jan 1, 2010
2.892
+0.009
0.33%
jan 1, 2011
2.899
+0.007
0.23%
jan 1, 2012
2.997
+0.098
3.4%
jan 1, 2013
3.006
+0.009
0.31%
jan 1, 2014
2.985
-0.022
-0.72%
jan 1, 2015
2.958
-0.027
-0.89%
jan 1, 2016
2.925
-0.033
-1.13%
Ranking of countries by current statistics by years