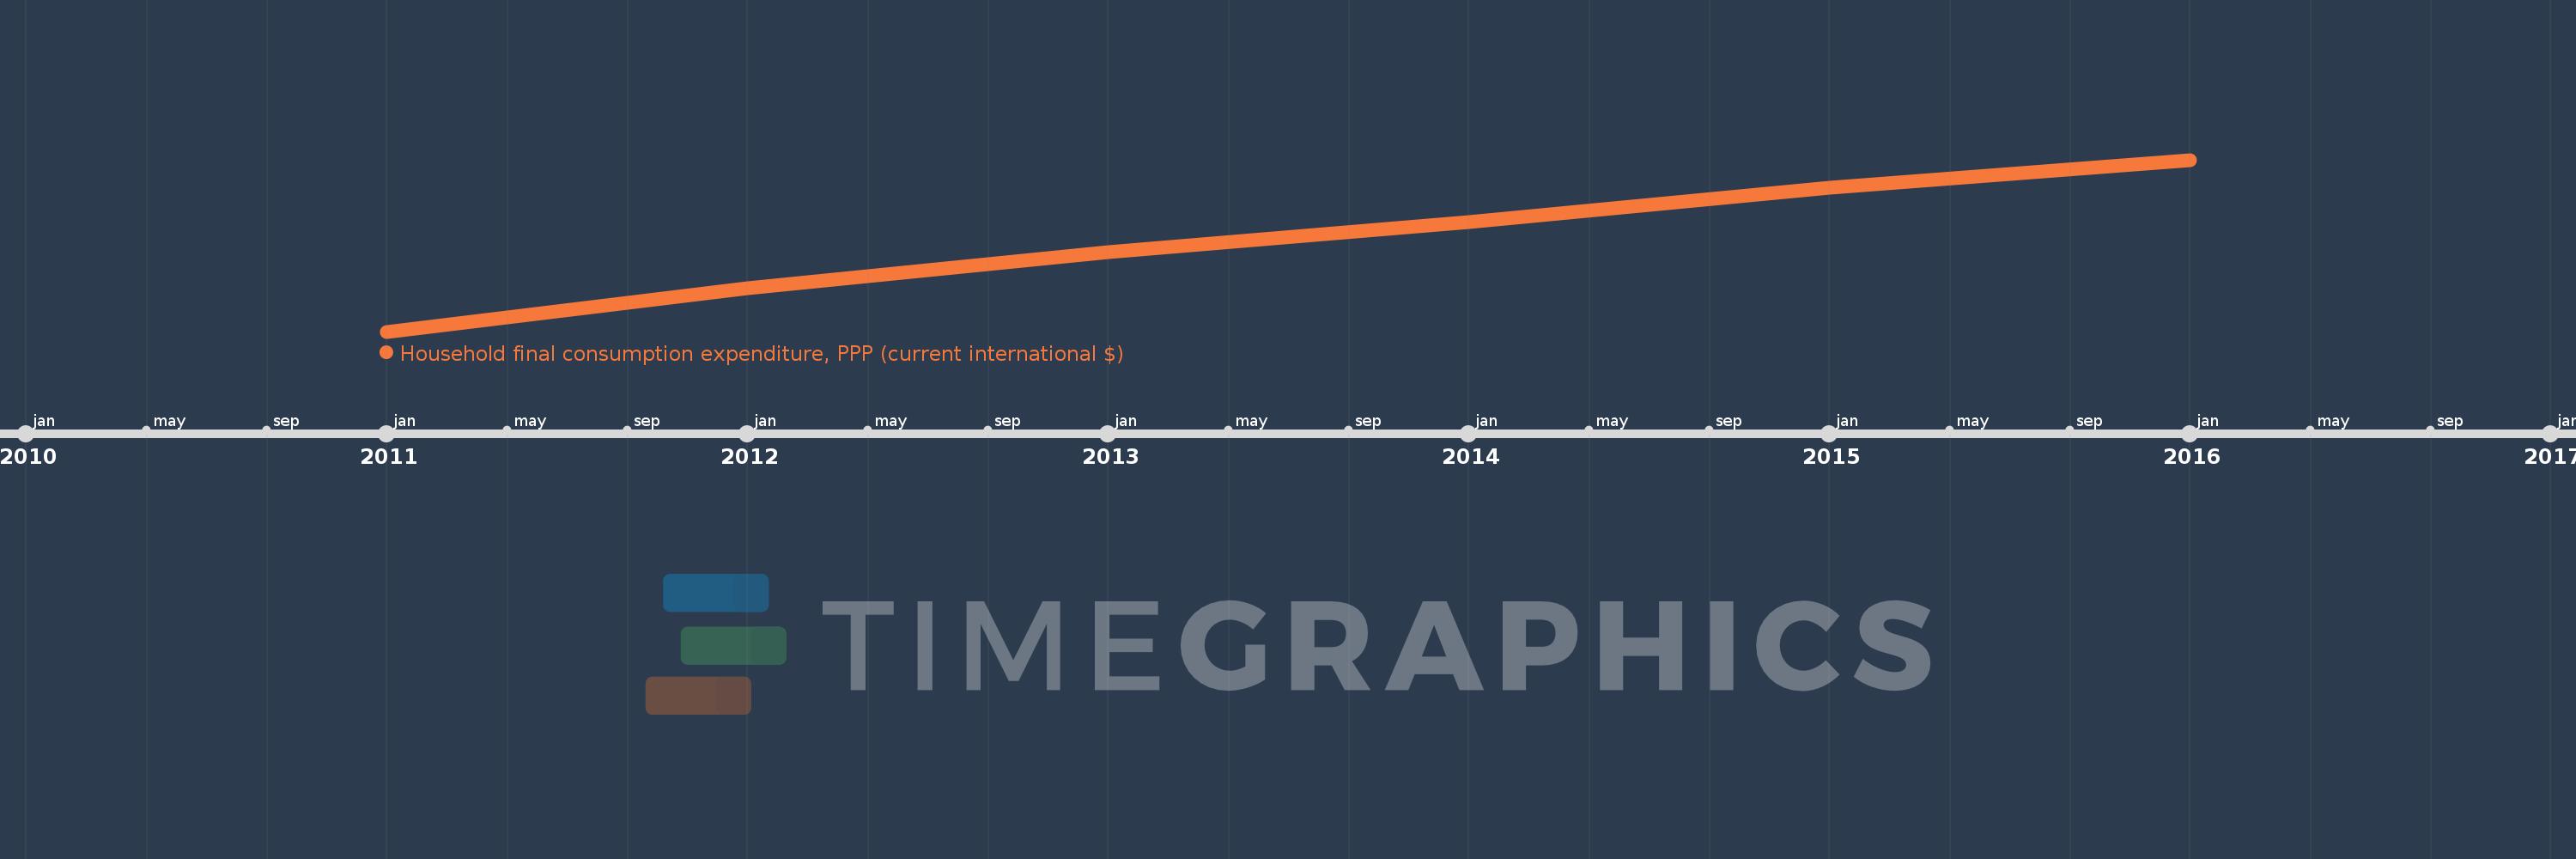
This timeline shows a graph from 2011 to 2016 of East Asia & Pacific (excluding high income). No data until 2010. Number of actual observations by date: 6.
Source name:
World Development Indicators
Source organization:
World Bank, International Comparison Program database.
Categories, topics:
Economy & Growth
Last updated:
apr 23, 2017
Indicators value changes by year
Meaning:
8.403 trl
Minimum:
6.376 trl
jan 1, 2011
Maximum:
10.194 trl
jan 1, 2016
At the date of observation
Value
Absolute change
Change from the previous value
jan 1, 2011
6.376 trl
+6.376 trl
0.0%
jan 1, 2012
7.336 trl
+960.636 bln
15.07%
jan 1, 2013
8.134 trl
+797.557 bln
10.87%
jan 1, 2014
8.81 trl
+676.2 bln
8.31%
jan 1, 2015
9.568 trl
+758.476 bln
8.61%
jan 1, 2016
10.194 trl
+625.342 bln
6.54%
Ranking of countries by current statistics by years